Analysis of 4 million climbing ascents
This article was updated on the 06/09/2022. Changes can be seen here.
A series on videos inspired by this article is also available on YouTube.
TL;DR
Here are the main findings from this article.
For climbers who achieve these grades, it takes on average:
- 4-5 years to climb their first 7a
- 8-9 years to climb their first 8a
- 12-13 years to climb their first 9a
If the average climber can flash up to:
- 6c, they can probably redpoint 7a
- 7b/+, they can probably redpoint 8a
- 8b, they can probably redpoint 9a
Using a mathematical model, we can predict it’ll take 19-20 uninterrupted years, since when one started climbing, to send a 10a and 22 years to send a 10b. Adam Ondra climbed Silence (9c) 18 years after he started climbing.
The average boulderer will climb their first 7A (Font) around the same time as the average sport climber with their first 7a (sport) route.
No, you haven’t plateaued. Your improvement is probably less than a “+” grade and you just can’t notice it.
If any of these triggered your attention, please read the rest of this article for more.
Introduction
I recently found a dataset on Kaggle that sparked my attention, 8a.nu Climbing Logbook. Since I love data, and I love climbing, this was the perfect opportunity to answer some of the questions that are often asked in climbing. I broke down the article into sections, you can jump to a specific question using the following links:
- What are the most logged ascents?
- What grade can you expect to redpoint (or flash) given your maximum flash (or maximum redpoint)?
- How many years does it take to climb a certain grade?
- How long will it take to climb the first 10a?
- Is it easier to climb a 7a sport route or a 7A (V6) boulder?
- What grade should you sport climb given your maximum bouldering grade?
- After how many years does the average climber plateau?
- How does the age you start climbing affect progression?
- How does height affect progression?
- How many routes are you expected to climb at your maximum grade before climbing the next grade?
- Does BMI (Body Mass Index) affect climbing?
- Where are the strongest climbers in the world from?
- What do climbers do for a living?
The dataset
The dataset includes 62,593 users (53,902 men and 8,691 women) who logged a total of 4,111,877 ascents (that’s more than 4 millions!), including sport climbing (n=2,875,675) and bouldering (n=1,236,202). The average number of ascents per user is 110, with the majority of the users (median) logging 35 ascents and 90% of them logging between 3 and 306 ascents. One single user, in total, logged 1,987 ascents; we don’t know much about him, but he’s climbed two 8bs and an 8b+.
“The most logged grade is 7a for sport and 7A for bouldering”
If we look at the histogram of grades for all the ascents, the most logged grade is 7a for sport and 7A for bouldering. It’s funny to see how “+” grades are climbed (or logged) less than “whole” grades, especially for bouldering. Grades 6A, 6B and 6C have around 100k boulder ascents, while 6A+, 6B+ and 6C+ have less than half. After 7a/7A, every little progress counts and all the grades have a more regular distribution.
“Grades 6A+, 6B+ and 6C+ have less than half the logs for 6A, 6B and 6C”
 |
|---|
| Figure 1 Histogram of grades of all logged ascents |
For sport climbing, the “+” vs “whole” grade is less noticeable, but it’s still interesting to see how the number of logged 8a is higher than 7c+, breaking an otherwise continuously decreasing distribution. To be fair, if you’re strong enough to climb a 7c+, why not jump straight on an 8a?
Max flash vs Max redpoint
In this section I’m going to answer the questions: “what grade can you expect to climb given your maximum flash?” and “what grade can you expect to flash, given your maximum redpoint?”. For those unfamiliar with climbing terms, to “flash” a route means climbing it on the first attempt, without falls or rests on the rope, using no other holds than the rock itself. To “redpoint” means climbing a route in the same conditions but after having practiced the moves (after any number of attempts).
To answer these questions, I grouped ascents by user and selected their maximum redpoint and flash/on-sight (OS) grades. I then averaged the results and plotted them against each other. Although the dataset discriminates between flash and OS, I decided to group them together because there were not enough datapoints for each category. The results are shown below.
 |
|---|
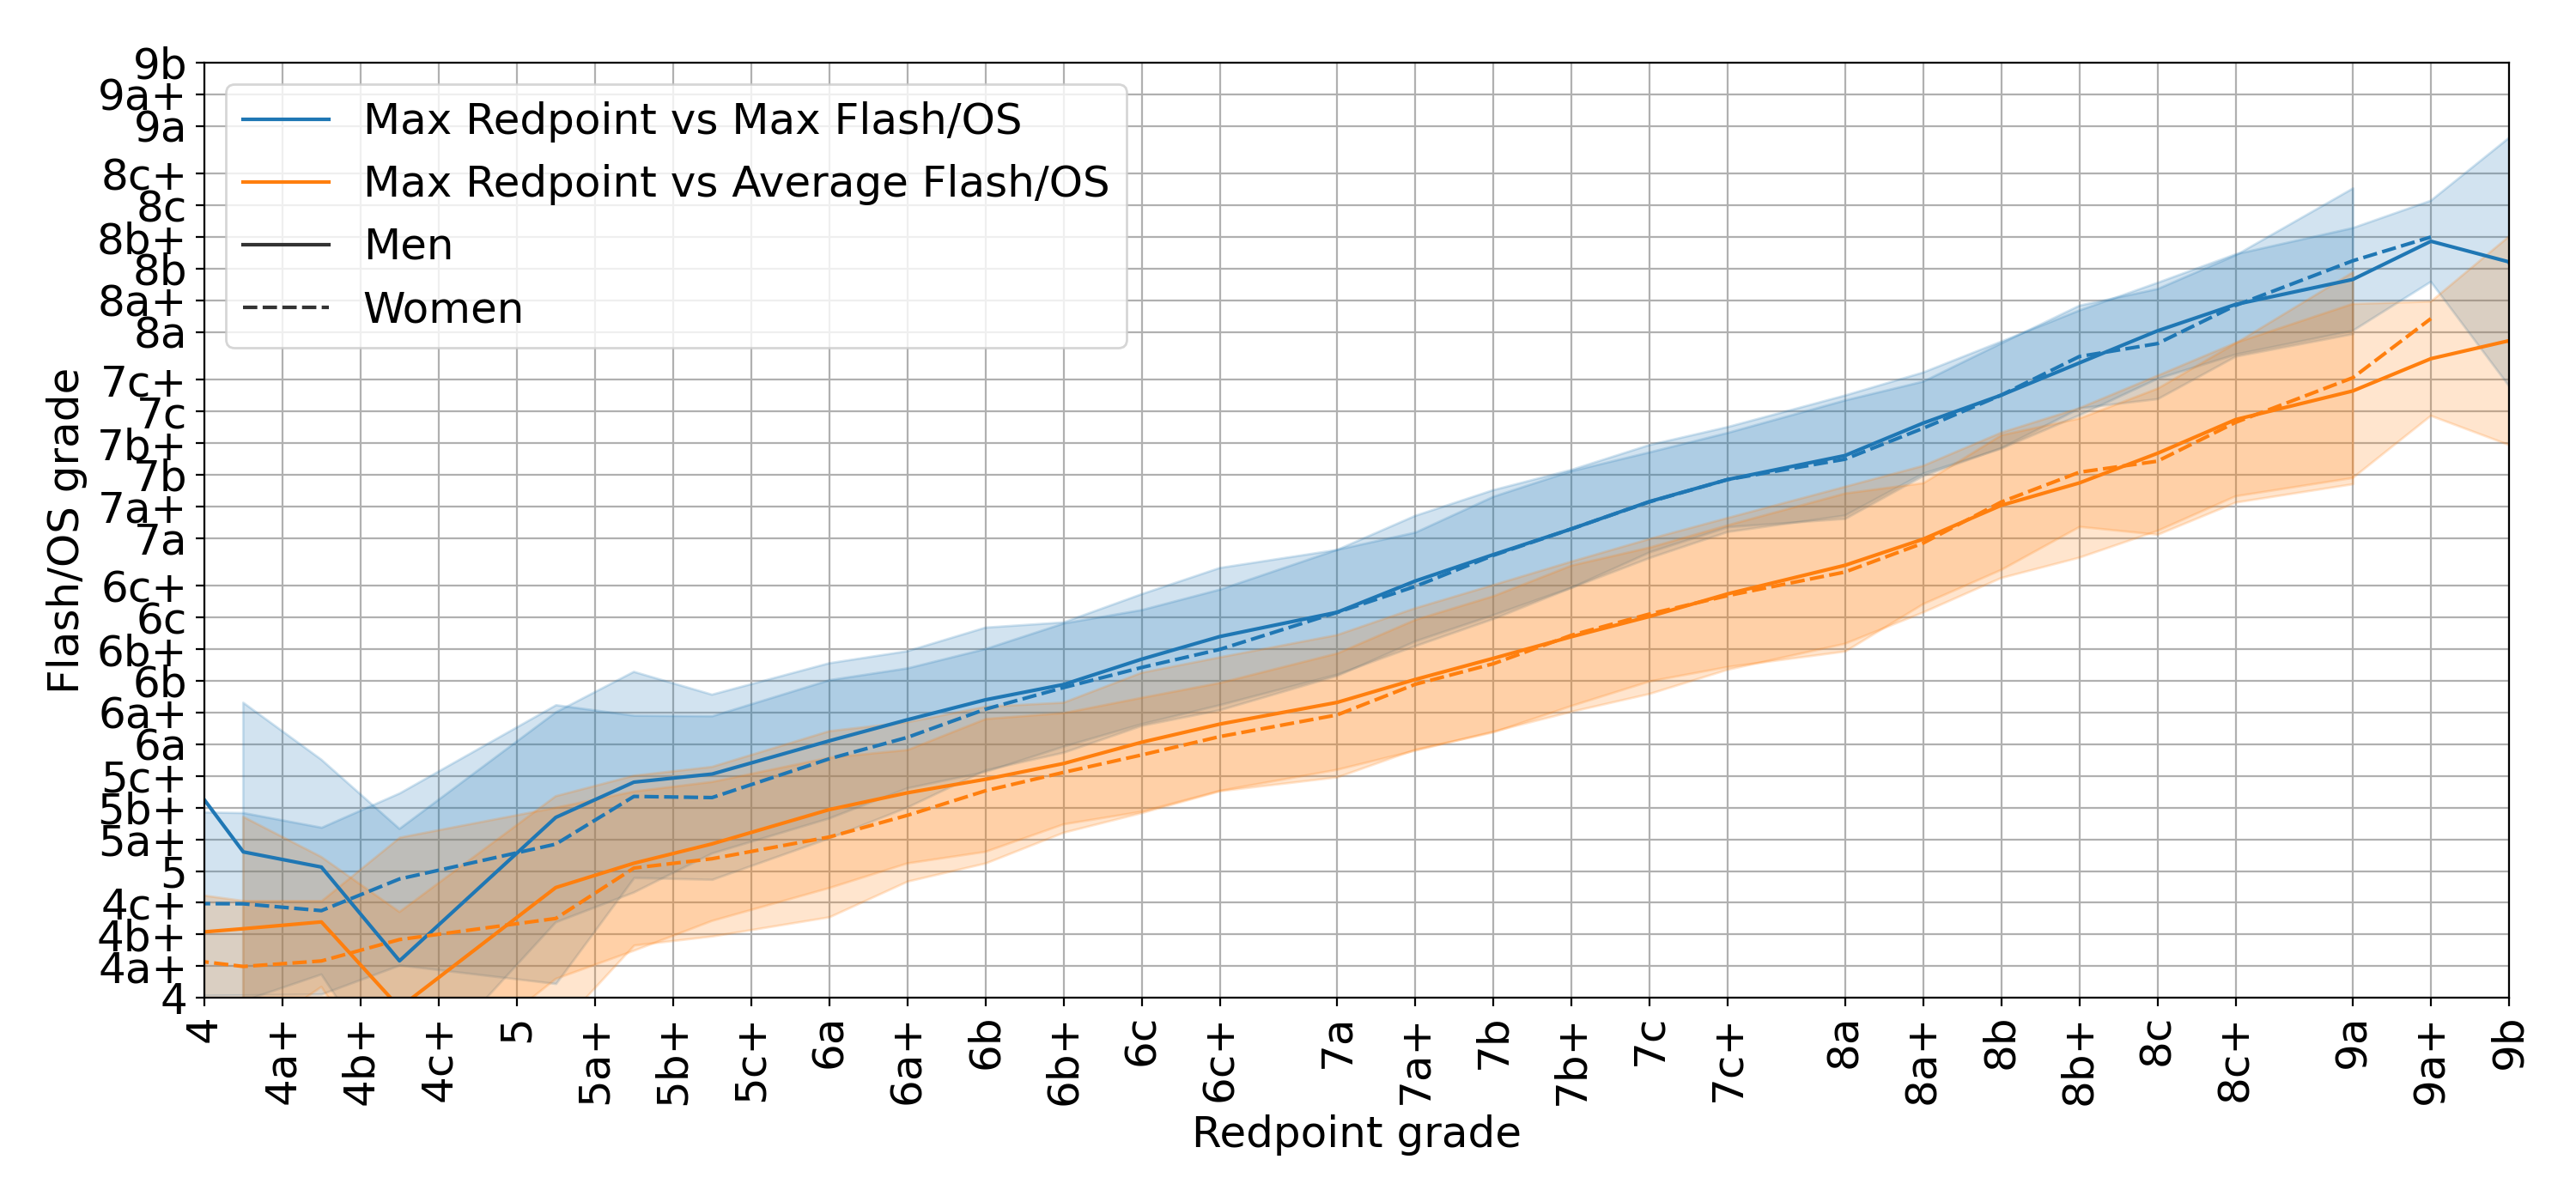
| Figure 2 Relationship between Flash/OS grade and Max redpoint grade for men and women |
The plot shows a solid line (dashed for women) to represent the mean, and a transparent area to represent the standard deviation. If you’re not familiar with the concept of standard deviation, consider that this plot applies within the transparent area to around 70% of all users. If you make it 3 times wider, the area will apply to 99% of the population.
The plot is very interesting and it can be read both by entering with a redpoint grade from the x-axis (horizontal) to read a flash/OS grade, or from the y-axis (vertical) with a flash/OS grade to read a redpoint grade. To take myself as an example, let’s start with the blue curve: my maximum redpoint is 7b, which according to the plot means that I should be able to flash 7a. My maximum Flash/OS grade is actually 7a+, which produces a 7b+/7c maximum redpoint. I have tried a few 7b+ and I’m definitely close to sending them, so the results seem to be valid for me. If we follow the orange curve, with a maximum redpoint of 7b, it says that I should be able to flash/OS, on average, 6b/6b+, which is probably the grade I feel the most confident I can flash/OS.
“To climb your first 7a, you need to be able to flash up to 6c and consistently flash 6a+/6b.”
“To climb your first 8a, you need to be able to flash up to 7b/+ and consistently flash 6c+/7a.”
“To climb your first 9a, you need to be able to flash up to 8b and consistently flash 7b/+.”
In appendix A1 you can find a table version of this plot to make it easier to read.
You can notice that for low grades, like max redpoint of 5a+, the expected maximum flash/OS grade is 5b+, which is higher than the redpoint grade. How can you flash up to 5b+ if your maximum redpoint is 5a+? The reason for this inconsistency is that data after 9a and below 5 becomes very fuzzy because the number of datapoints is very low. If we plot the histogram of users for the maximum grade they climbed:
 |
|---|
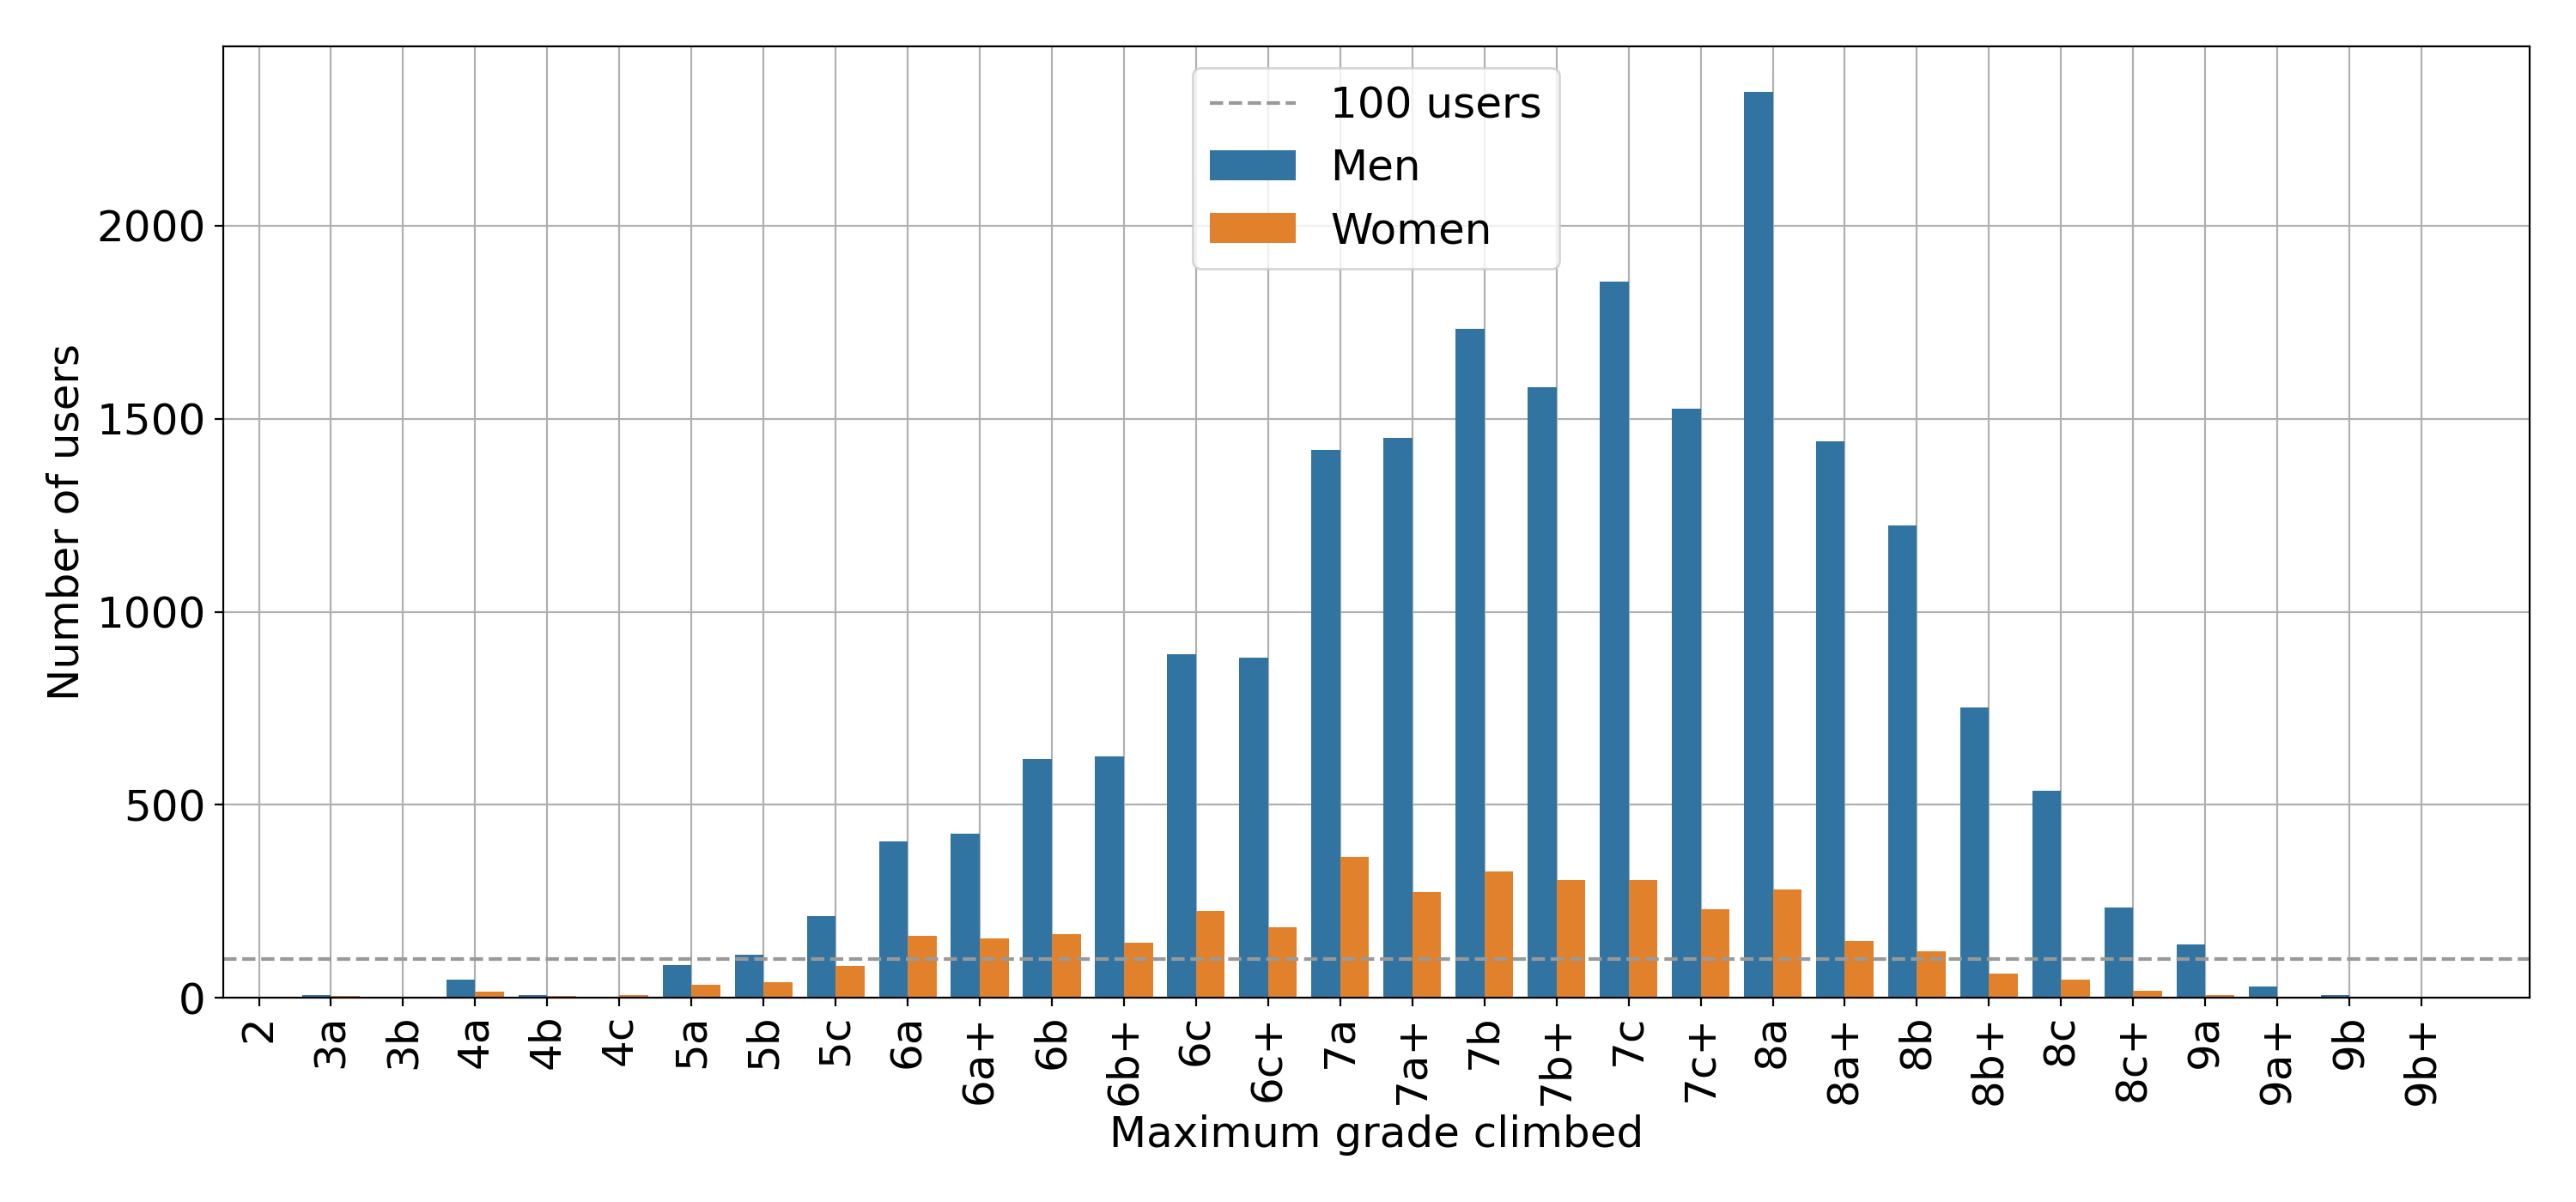
| Figure 3 Histogram of maximum grades for men and women |
the plot shows that below grade 5b (6a for women) and above 9a (8b for women) the number of users is less than 100 and any estimation is very unreliable.
Progression in time of grades
The next question that I want to answer is: “how many years does it take to climb a certain grade?” I have seen a few articles online trying to answer this question, and some of them used the same dataset as this article. As a challenge, I preferred not reading them and trying my own thing. To answer this question, I thought of two different approaches, let’s call them historical progression and max grade per user. Since the first approach didn’t seem to work properly, I’ll leave it in the appendix (A2) and describe here the method that worked.
Max grade per user
The easiest way to calculate the progression of grades in time is to look at the maximum grade that each user has ever climbed. The date the user climbed this route, minus the date they started climbing, allows to calculate the number of years required for this user to climb that grade:
years_required = max_grade.year - user.started
Each user in the dataset therefore becomes a pair of (max_grade,
years_required) which we can plot.
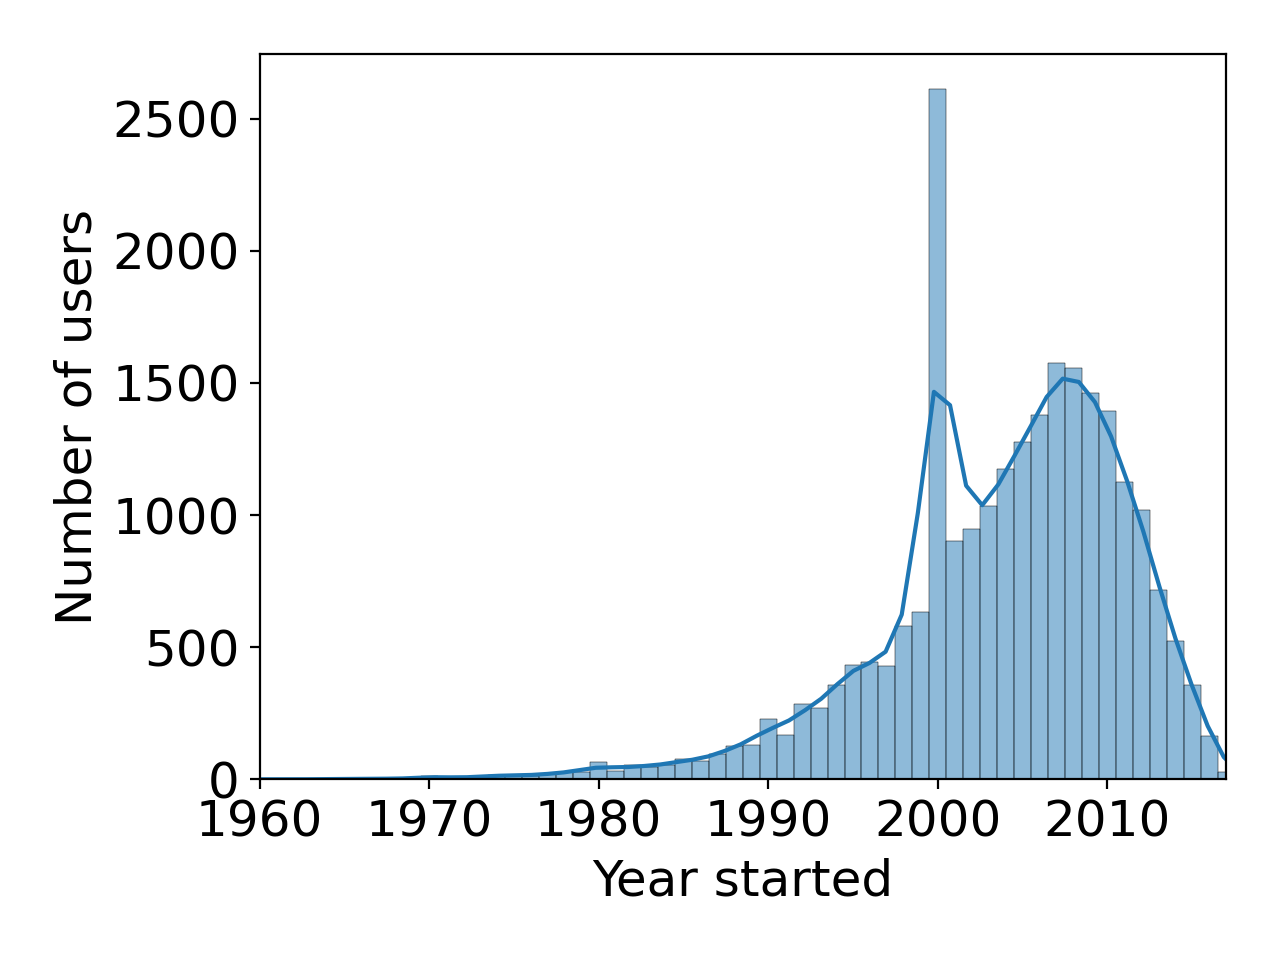
Unfortunately, almost half of the users (n=25,121) had to be excluded from this analysis because they didn’t set up the date they started climbing in their profile. Some other users simply had impossible numbers as dates, so I restricted the analysis to all the users who started climbing between 1960 and 2017 (the year the dataset was collected). A histogram of the years people started climbing is shown below:
 |
|---|
| Figure 4 Histogram of year when users started climbing |
For some very weird reason, the year 2000 has almost 5 times the number of people who started climbing the year before and after. This is clearly an irregularity in the data. Maybe 2000 was the default choice on the website when the user first registered? Or maybe the part of the dataset was populated with some script that had 2000 as the default year? Anyway, I decided to exclude climbers who started climbing in 2000 because I didn’t trust their data, and ended up with a total of 29,739 users to play with.
Years required to climb a grade
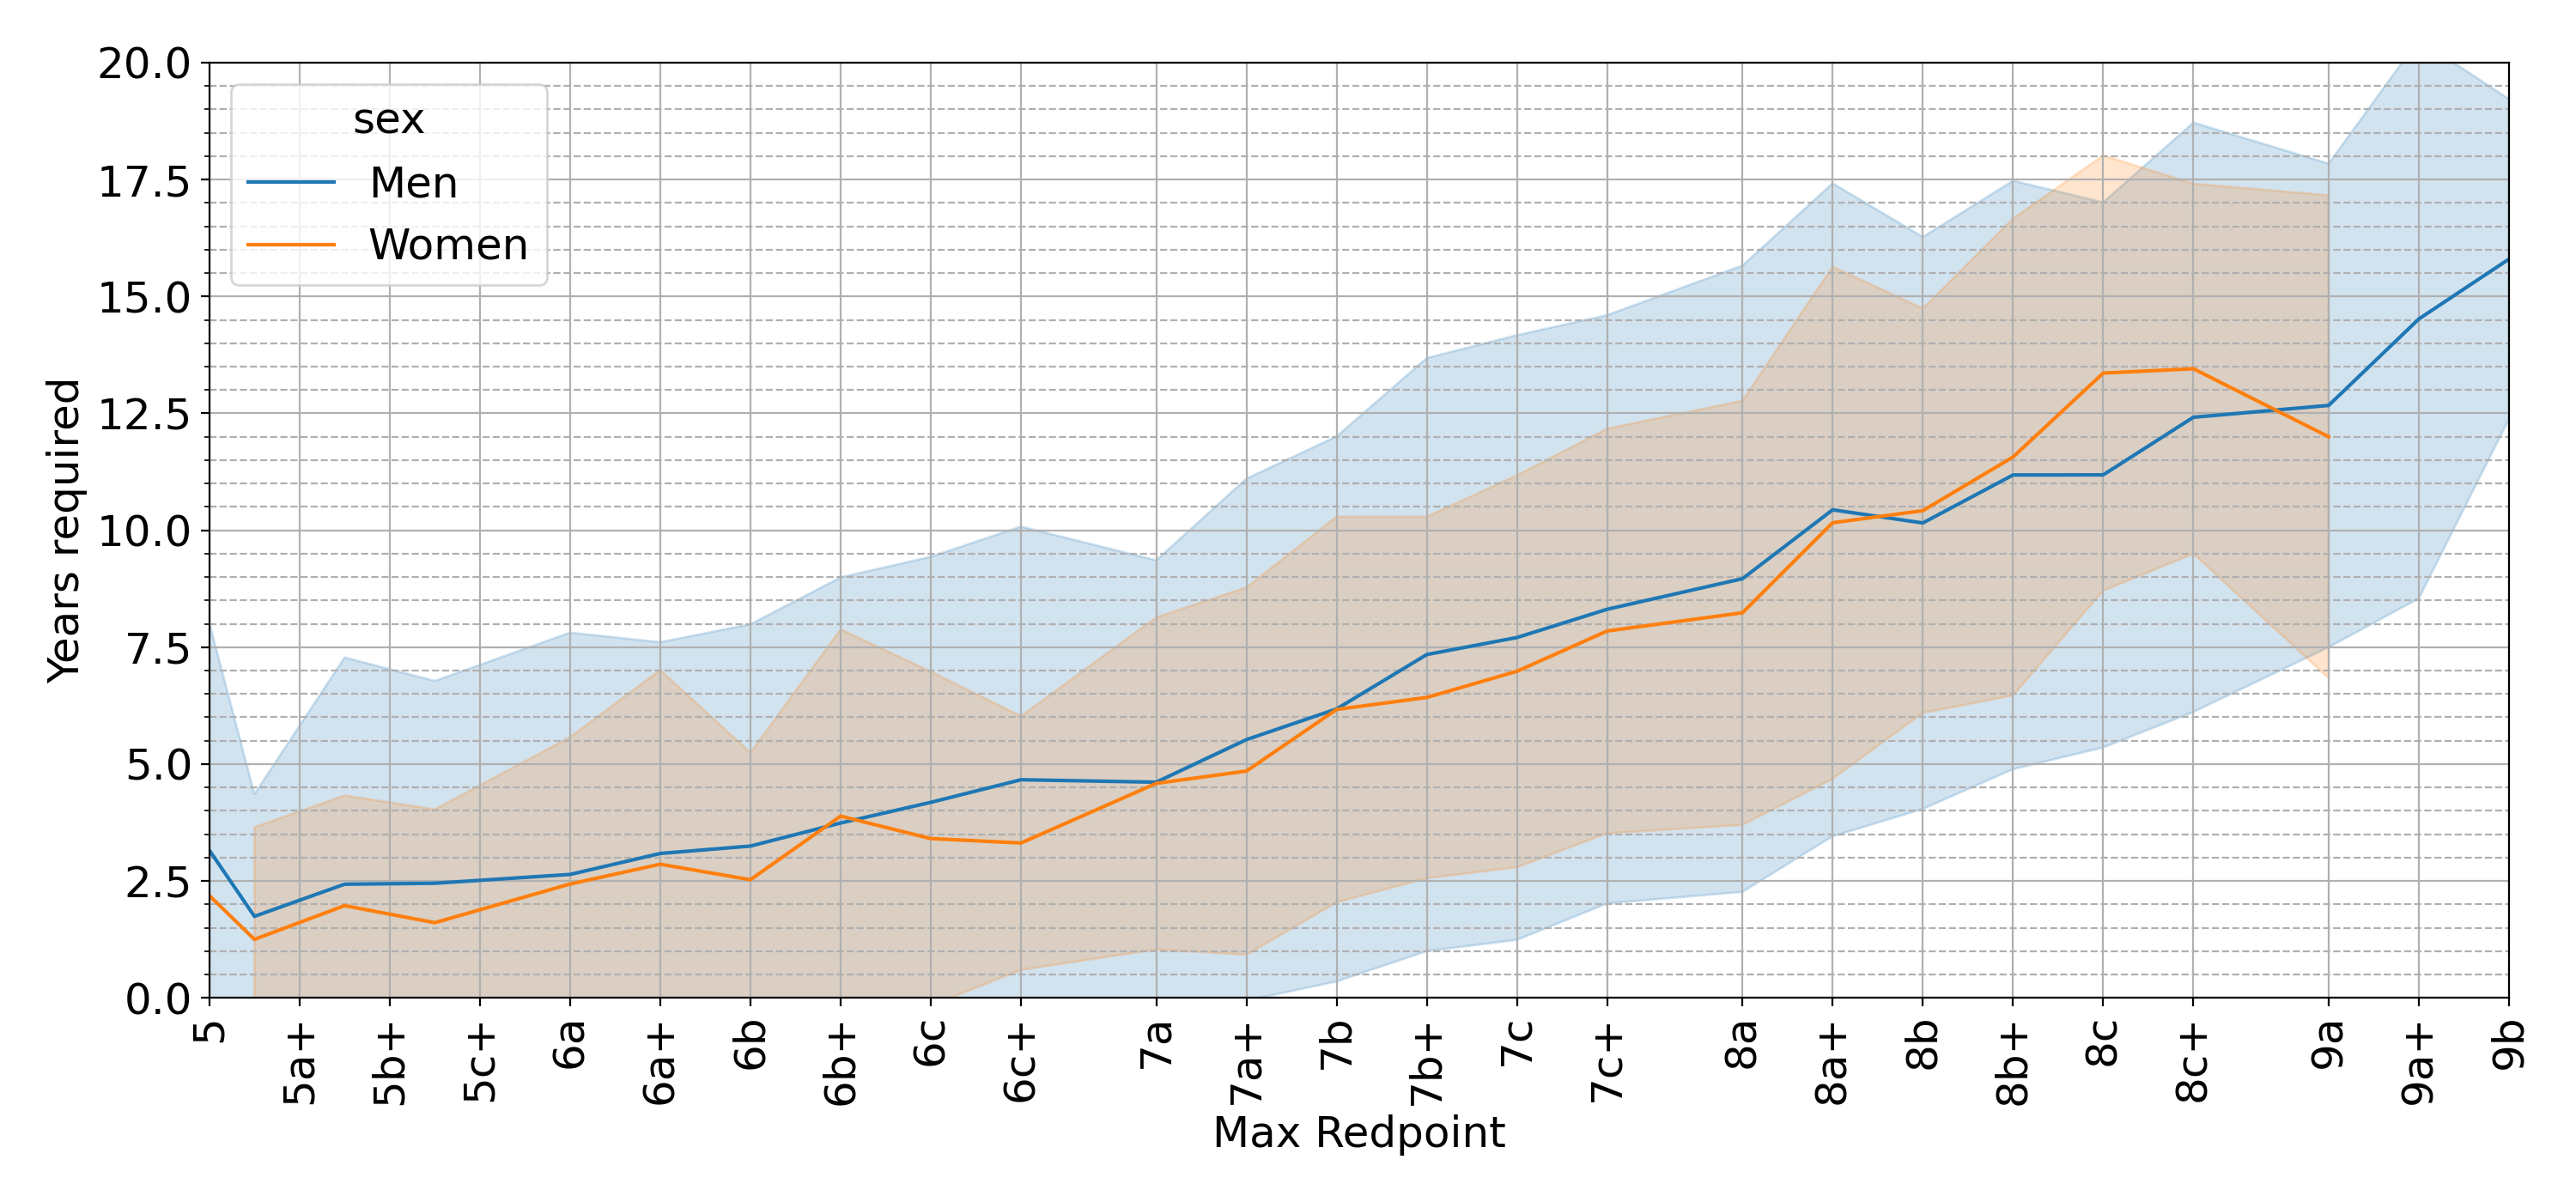
The plot in Figure 5 shows the average number of years required to redpoint a certain grade for the first time, for men and women, in sport climbing. This plot was created by first aggregating users by the maximum grade they’ve ever climbed and then averaging across the number of years it took them to send that grade. This means that what we read on the vertical axis is an average of years across users.
 |
|---|
| Figure 5 Average number of years required to ascend a specific grade on redpoint |
This plot can be read by entering the redpoint from the horizontal axis and reading the number of years required on the vertical axis. From the plot, it takes on average 4.5 years to climb 7a, 6 years to climb 7b, 8-9 years to climb 8a and 12 years to climb 9a. Again, to validate it on myself, I started bouldering in 2016, started sport climbing in 2020 and I sent my first sport 7a in 2021, which is around 5 years after I started. I only sent my first sport 7b this year (2022), which is exactly 6 years after I started climbing, as predicted by the data. I guess that makes me the average climber.
“It takes on average 4.5 years to climb 7a, 6 years to climb 7b, 8-9 years to climb 8a and 12 years to climb 9a.”
Although the plot from Figure 5 seems to depict a very simple picture (it takes y years to climb x grade), the story is more complicated than that. In fact, if we look at all the people that have climbed 7a as a maximum grade, and we look at how long it took them to send this grade, we get a very complex picture:
 |
|---|
| Figure 5b Histogram of years required to climb a 7a |
From the figure, you can see that while the majority of the climbers does, indeed, take 4-5 years to climb their first 7a, the data shows that it takes anywhere between 0 and 35 years to tick this grade! The plot also shows a higher variability in “years climbing” for men than for women, which skews the men’s average slightly upwards.
Predicting the future
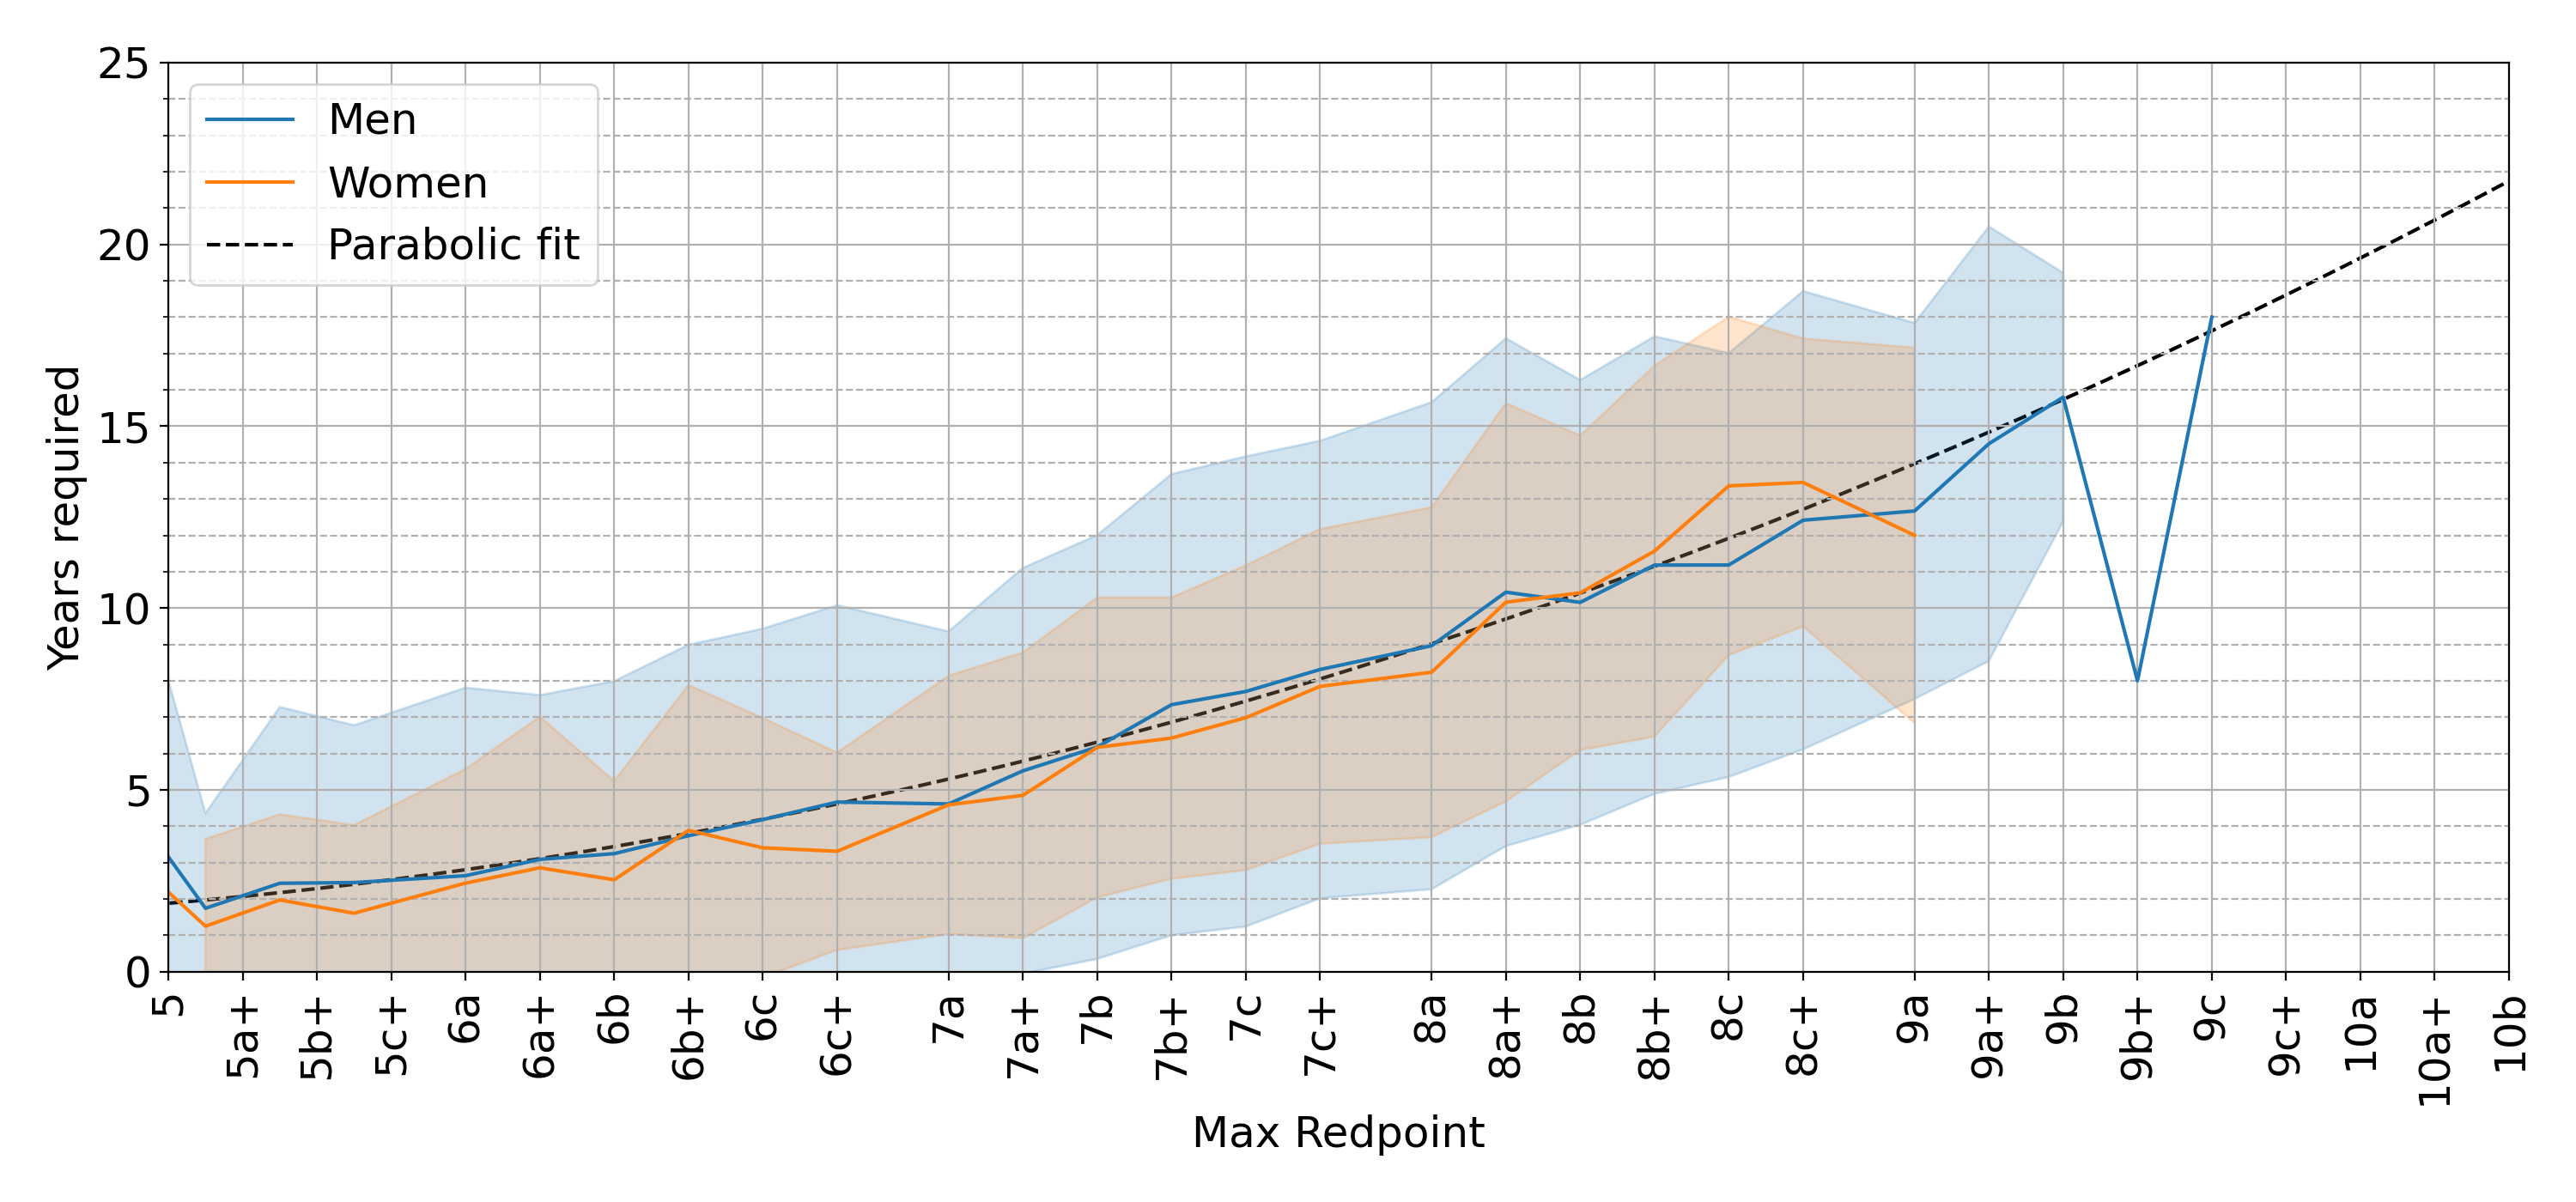
The number of datapoints after 9b is too little to draw any meaningful information after that grade, however, math can help us to make an educated guess of what happens. The number of years seems to have a non-linear relationship with the grade. To me, the relationship seems pretty much parabolic. If we fit a parabolic function through all the data, this is what happens:
 |
|---|
| Figure 6 Parabolic fit of data from Figure 5 |
The parabola seems to fit the data pretty well. If my math is right, it should require around 20 years to climb the first 10a and more than 22 years to climb a 10b. Adam Ondra, the only datapoint for 9c in this dataset, climbed Silence (9c) in 2017, which is 18 years after he started climbing, just as predicted by this model. Maybe, if he didn’t focus on the Olympics and kept climbing outdoors, he might have already climbed the first 10a!
“If my math is right, it should require around 20 years to climb the first 10a and more than 22 years to climb a 10b.”
It’s important to note that while this model can be used to extrapolate data indefinitely, it doesn’t mean that it makes any real sense. The majority of the data used to fit the parabola is between grades 5 and 9a, with only a few datapoints available beyond 9a. Moreover, the only climbers who can achieve grades higher than 9a are professional athletes, who probably started climbing when they were really young. Having started climbing in my 20s, I would not expect to climb a 9a in my late 30s! On top of that, when we reach grades beyond 9c, we might be getting close to the limits of the human body. Extrapolation is cool but always a dangerous ground, so take these results with a pinch of salt :D
“If you started climbing in your 30s, don’t expect to climb a 10a in your 50s!”
Bouldering vs sport climbing
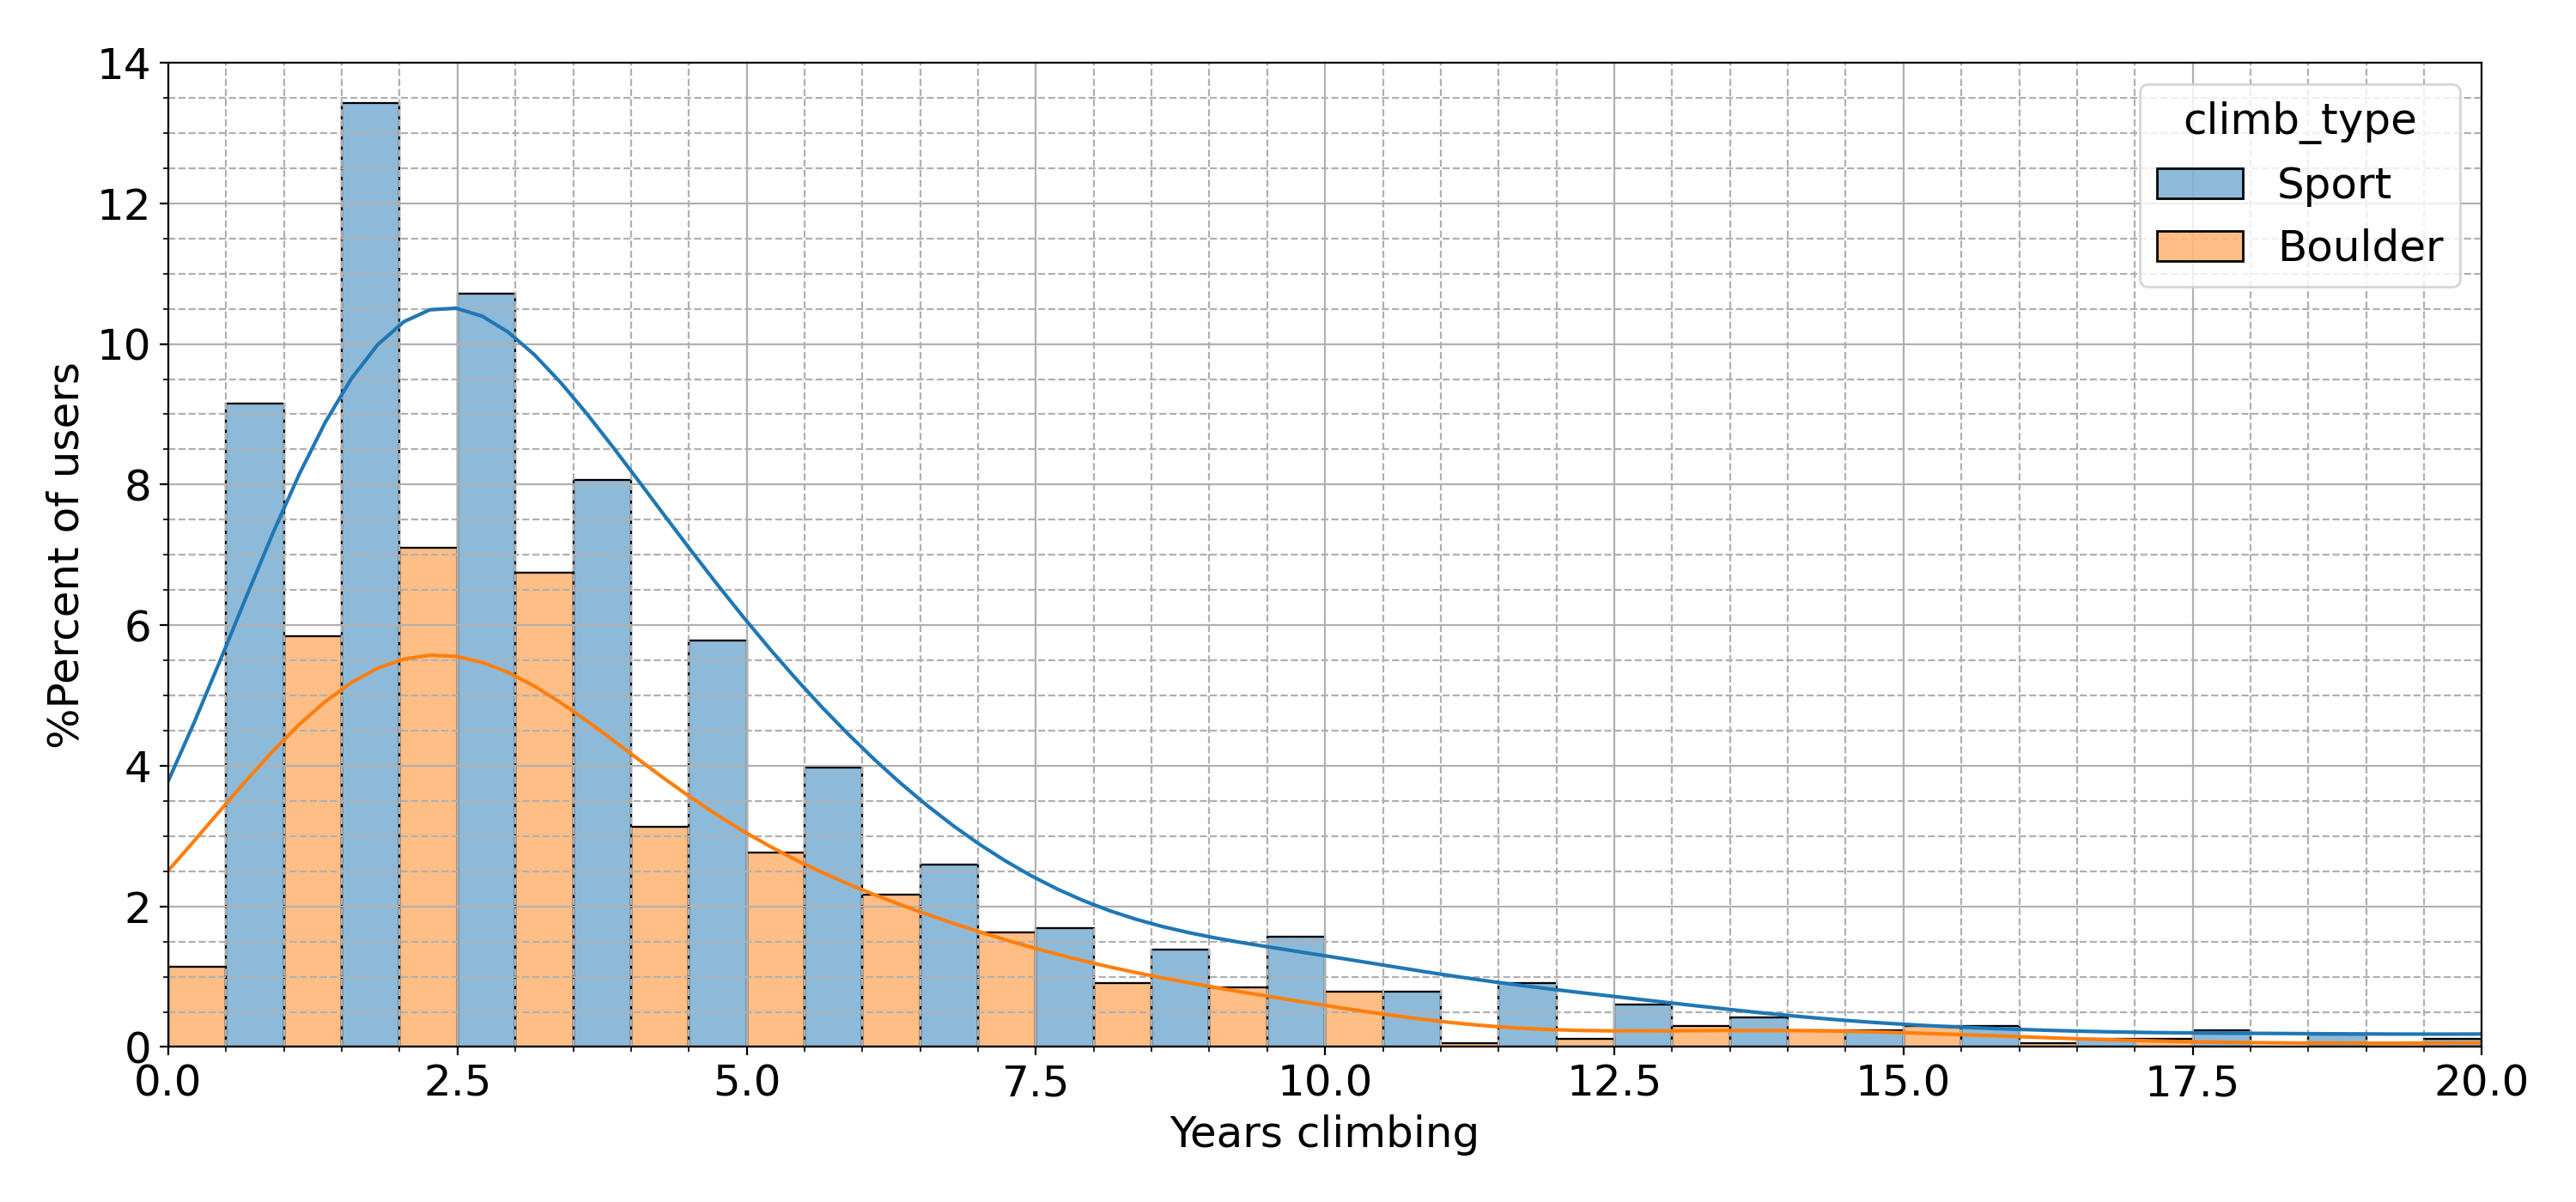
The results so far only considered sport climbing, but what about bouldering? Let’s try to answer this question: “Is it easier to climb a 7a sport route or a 7A (V6) boulder?”. By using a similar approach to the last section, we can produce a plot distinguishing between sport climbing and bouldering:
 |
|---|
| Figure 7 Average number of years required to climb a specific grade for bouldering and sport climbing |
The lines are very noisy but there’s a hint that the bouldering one, between 6B and 8B, is below the sport line. What does this mean? Let’s investigate further and look at the histogram of number of years required to climb 7a for both sport climbing and bouldering:
 |
|---|
| Figure 7b Histogram of years required to climb a 7a |
The figure shows a very complex picture and it’s very difficult to tell, graphically, if it’s easier to climb a 7a route or a 7A boulder. This is why statistical tests exist, they help us to quantify results using data. Without going too much into detail, I ran a t-test on the number of years required to climb a 7a sport and the number of years required to climb a 7A boulder. The result (t=1.172, p=0.241) shows that there is no statistically significant difference between the two distributions.
“It takes the same time for a boulderer to climb their first 7A as a sport climber to climb their first 7a route.”
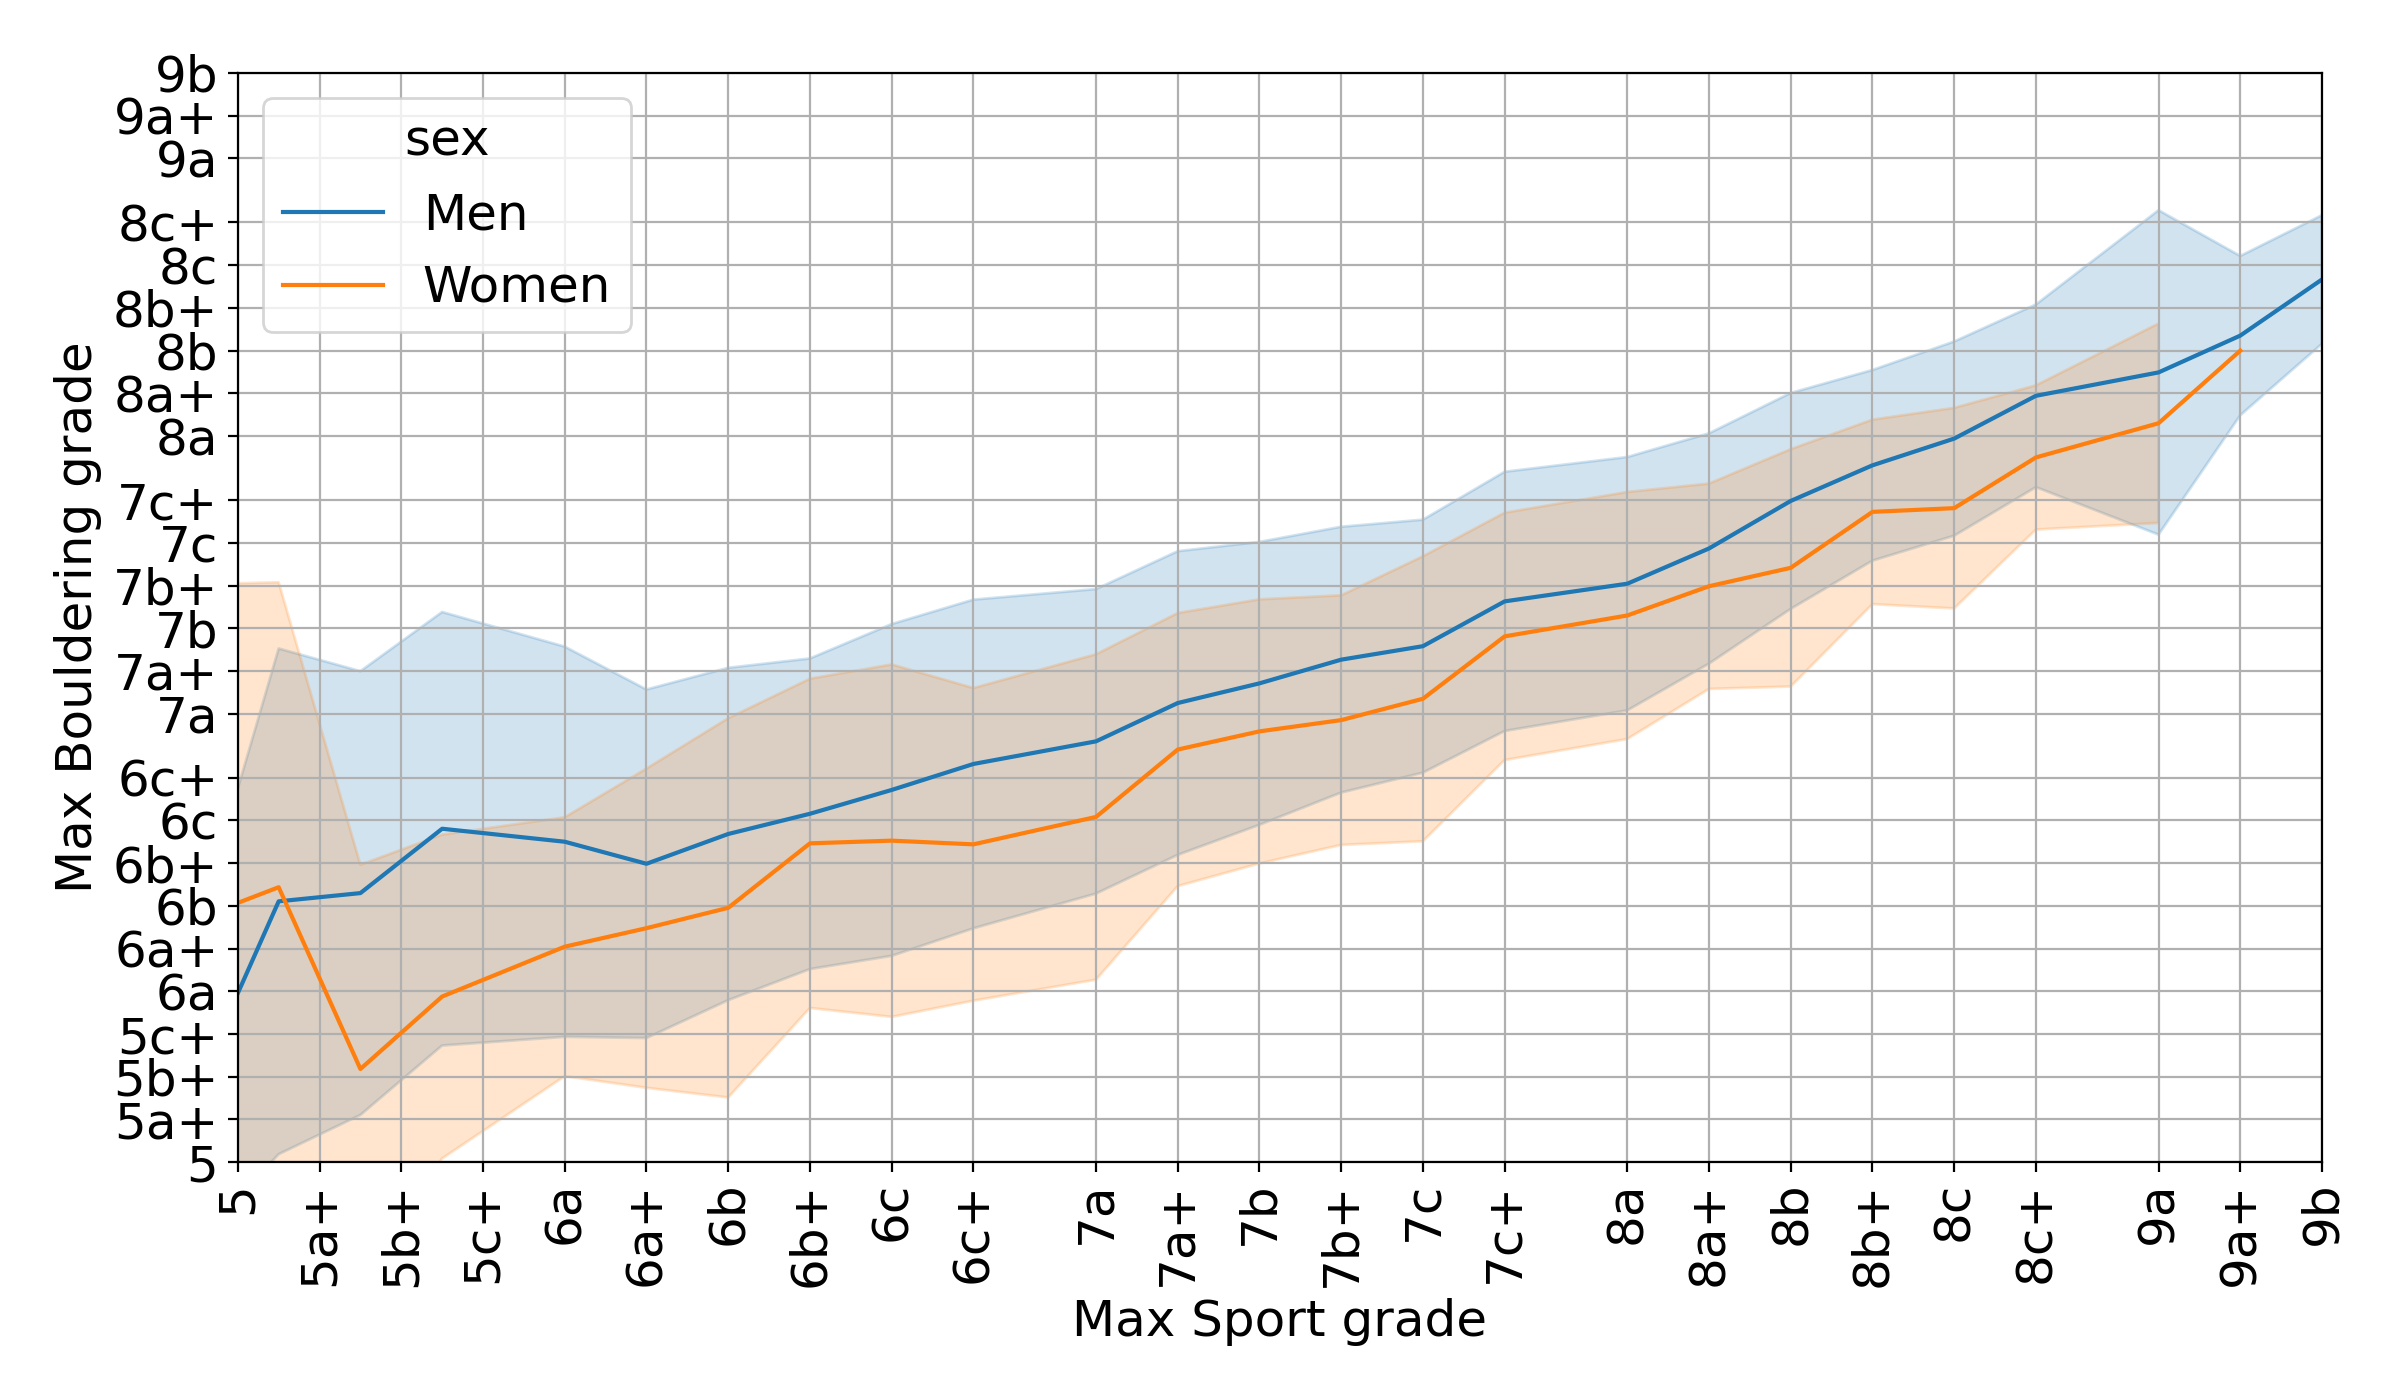
Another question that we can answer using data is how grades compare between bouldering and sport climbing. In sight of the next Paris 2024 Olympics, where sport climbing and bouldering will be combined for the same medal, it’s interesting to look at all the users in the dataset who practice both sport climbing and bouldering. Of the 30,844 total users who practice sport climbing and the 19,253 who practice bouldering, only 14,105 practice both disciplines. If we focus on this group of users, we can calculate their maximum grade for sport climbing, maximum grade for bouldering and plot them against each other.
 |
|---|
| Figure 7c Average maximum bouldering grade vs maximum sport climbing grade |
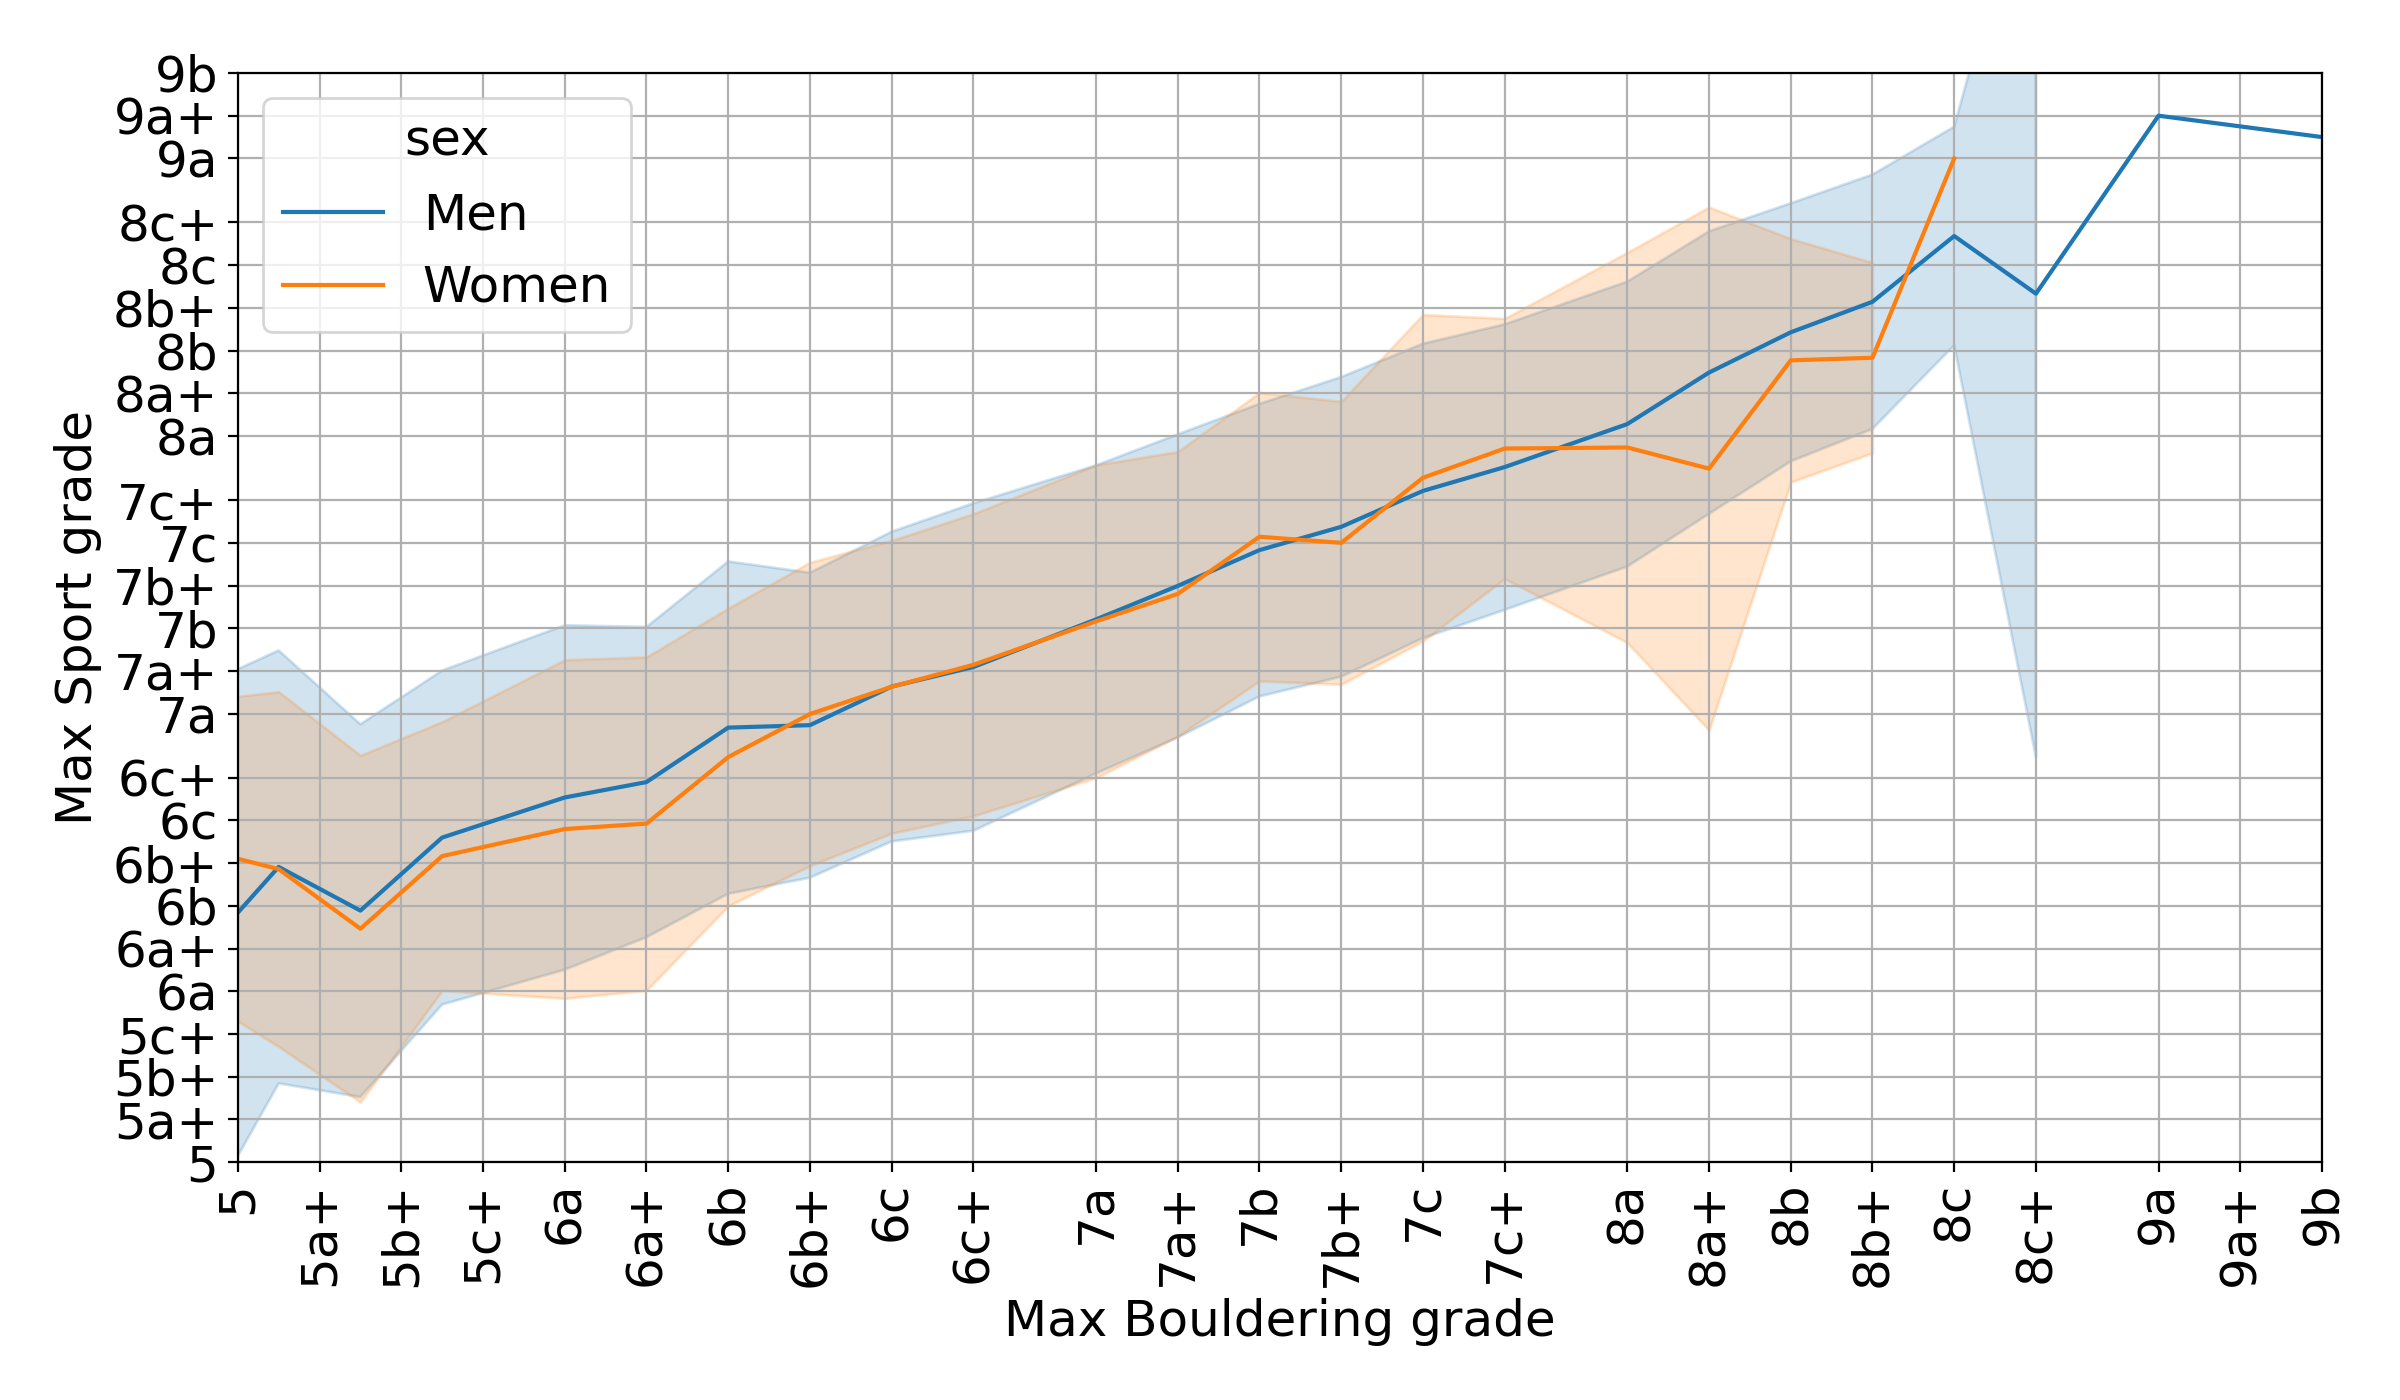
In the first plot, we average the users’ maximum bouldering grades given their maximum redpoint, both for men and for women. From the plot, we can see that men who sport climb similar grades to women tend to climb slightly higher boulder grades than women, on average. For example, men who sport climb up to 7a tend to boulder up to 6C+/7A, whereas women who sport climb up to 7a have a maximum bouldering grade of 6C. However, if we invert the axis and plot the average maximum sport grade against the bouldering grade, things are different:
 |
|---|
| Figure 7d Average maximum sport climbing grade vs maximum bouldering grade |
From this plot, we can see that men and women who boulder up to a grade between 6B+ and 8A have an average maximum redpoint grade which is pretty much identical.
“Practicing both bouldering and sport climbing, if you can boulder a 7A, you can probably sport climb a 7b.”
Progression of maximum redpoint
A different way to plot the data is to aggregate users first by how long they’ve been climbing for and then average the grades they climb. If we plot the variables in this way, the graph shows us the progression of max redpoint for the average climber.
 |
|---|
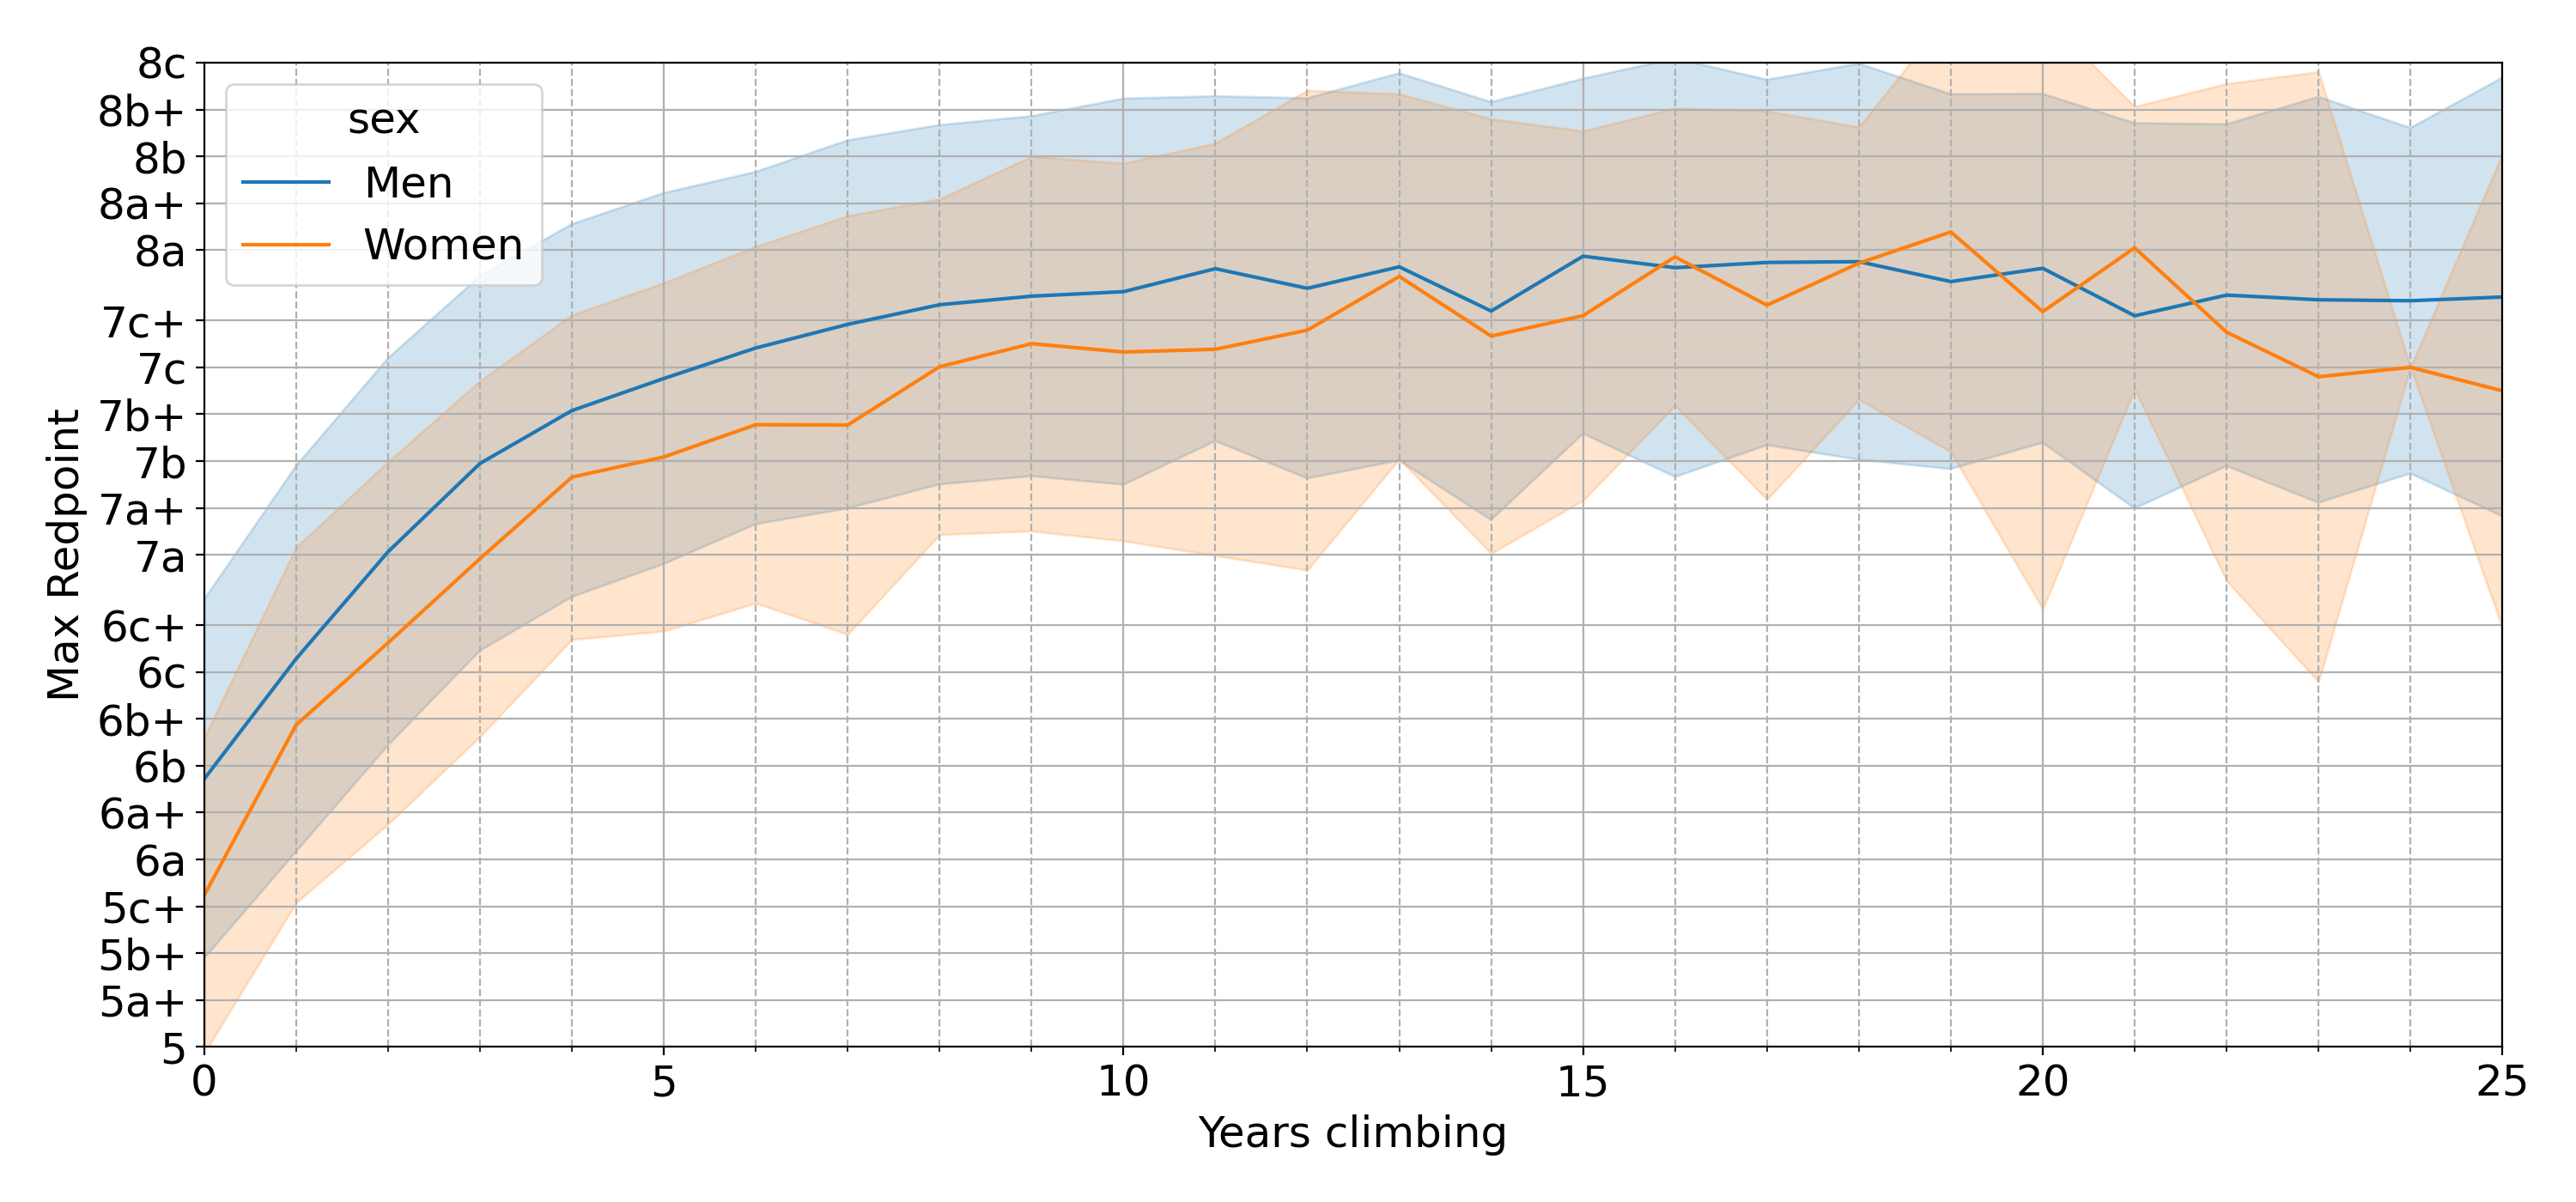
| Figure 8 Average maximum grade for men and women climbers vs years since started climbing |
Men start, on average, with a max redpoint of 6b, while women start just below 6a. The progression is very similar for men and women, with the average men climbing their first 7a in about 2 years and the average women in 3. The curve seems to plateau around 8a after 10-15 years, with men and women climbing around similar grades at that point. You can see from this plot that the curve doesn’t even get close to grades in the 9s, because the average climber, no matter how long they’ve been climbing for, will never climb harder than 8a.
It’s important to notice that the meaning of this plot is slightly different from the previous one in Figure 5. While the plot in Figure 5 shows the average number of years required to climb a specific grade, this plot shows the average grade climbed by users that have been climbing for a specific amount years. More details about this can be found in the appendix (A3).
Improvement over years and plateau
A comment that I often hear among climbers is the feeling of having plateaued and not improving anymore. So, let’s try to answer this question: “when does the average climber plateau?”. Given the data from the previous plot, we can calculate the derivative for max redpoint with respect to time. Since the data is noisy, I used a Savitzky-Golay filter to calculate the numerical derivatives.
 |
|---|
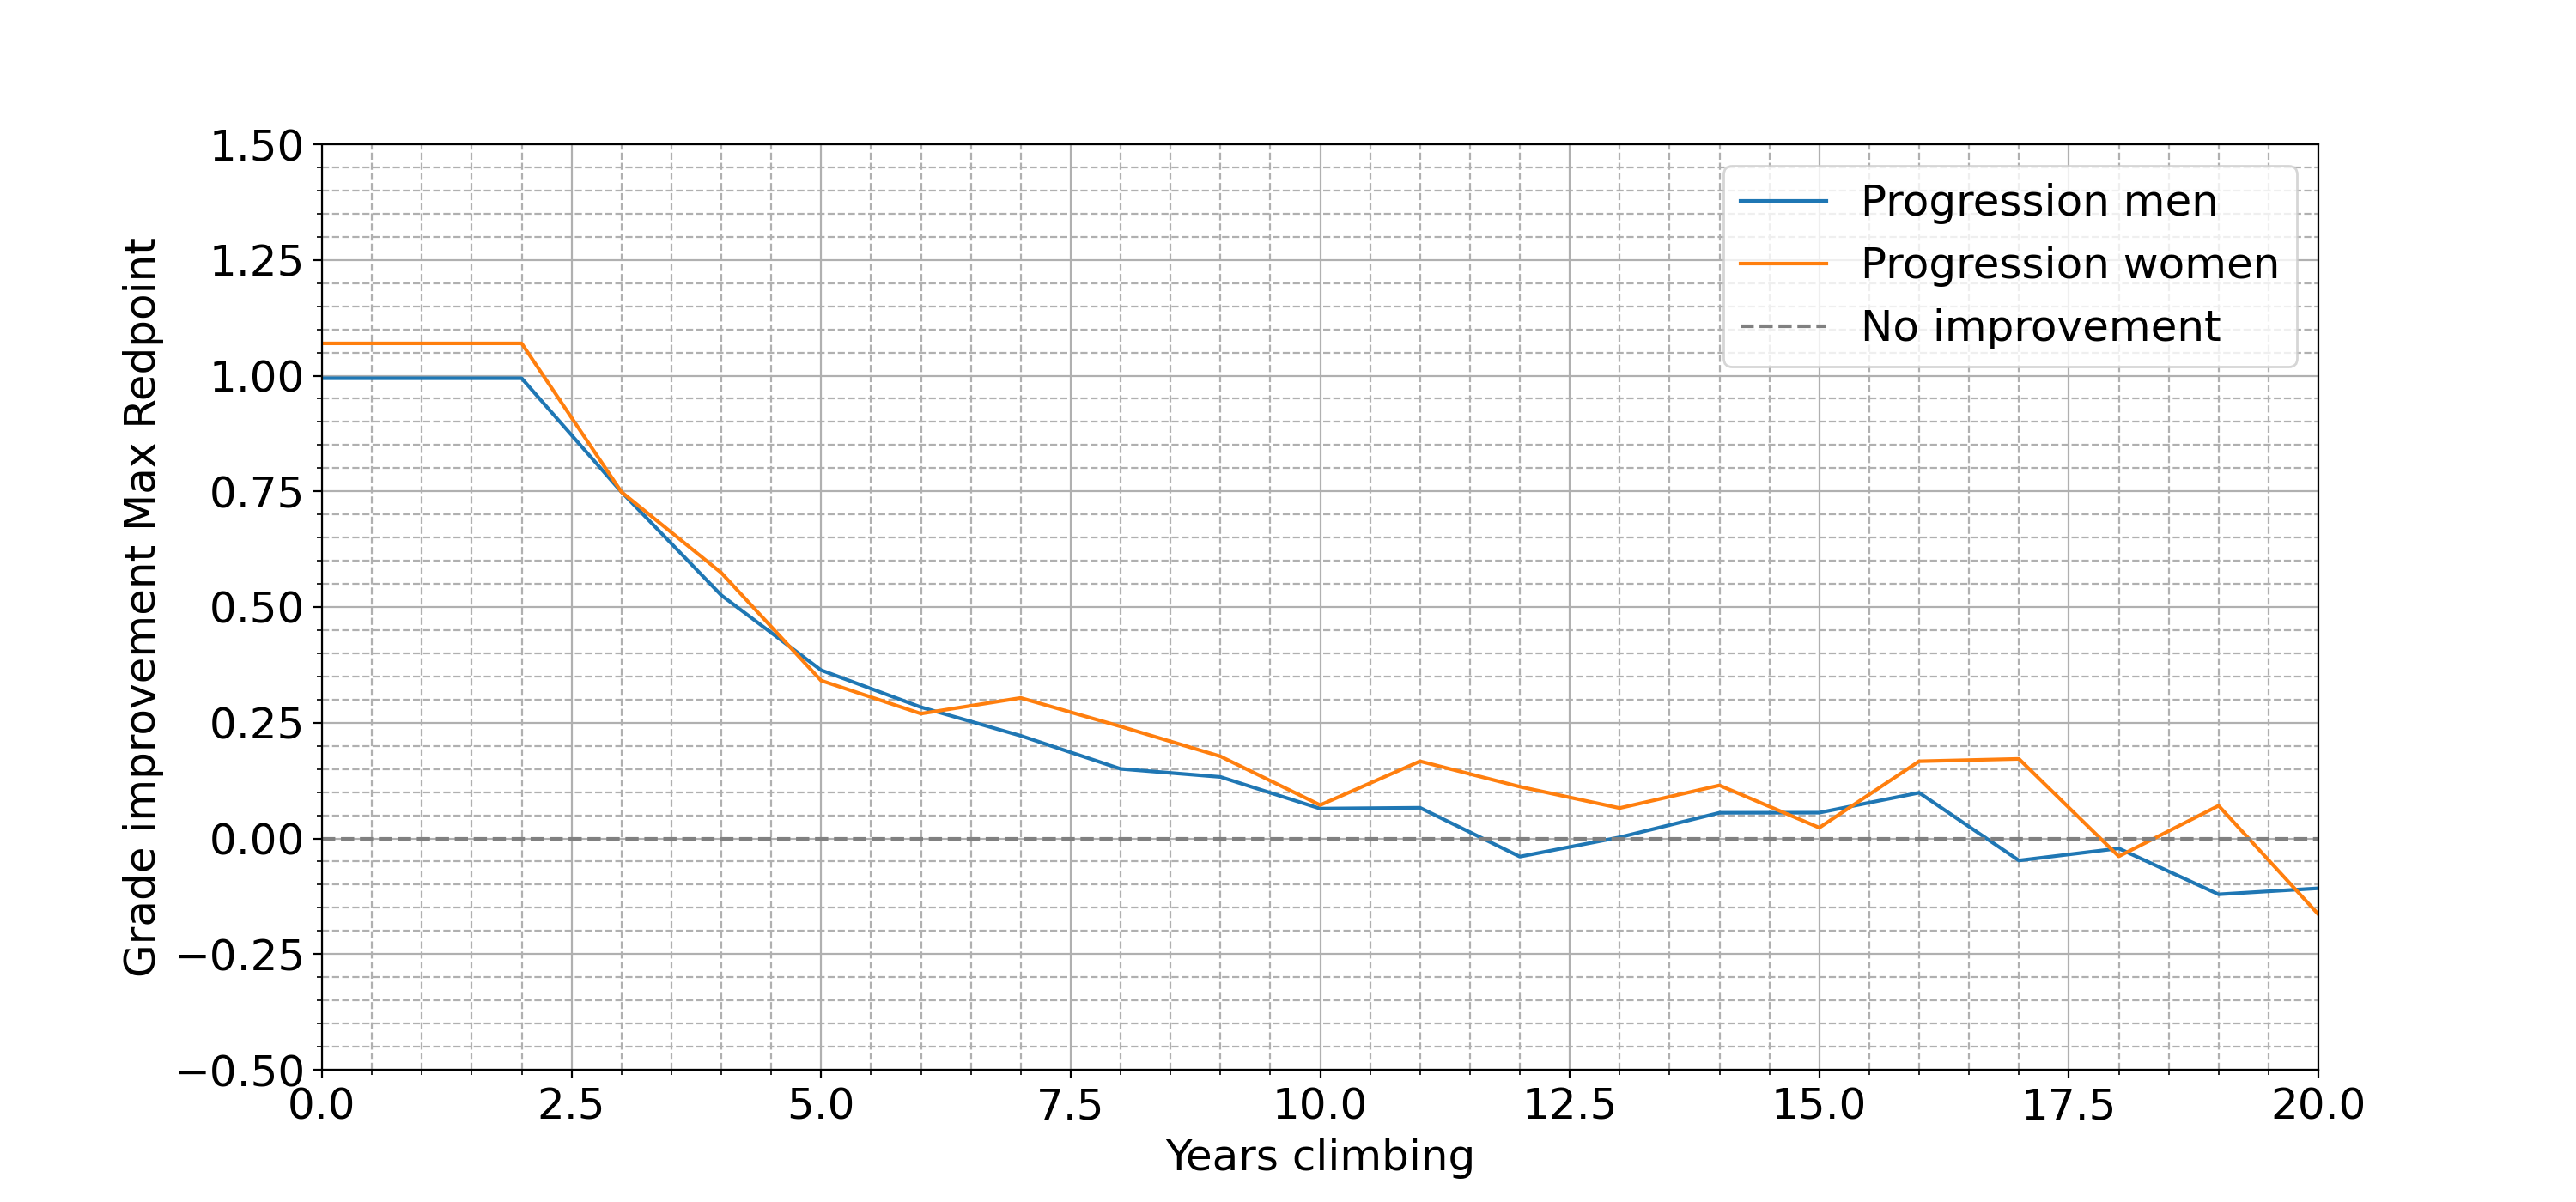
| Figure 9 Average maximum grade improvement (derivative) for men and women climbers vs years since started climbing |
The plot shows that for the first 2-3 years, climbers improve on average one whole grade per year (6a, 6b, etc.). After 4 years, the improvement is in the range of a “plus” (0.5 of a grade in the plot), whereas after 6 years the improvement becomes less than a quarter of a grade. From this point on, the improvement becomes less than the minimum difference that we use to grade two routes, and this is probably what causes that feeling of plateau that I was talking about. It’s important to remember, however, that improvement is not just sending the next grade, but also how confident you feel when you’re sending a certain grade and how many attempts it takes to send it.
The actual plateau can be estimated by looking at the point where the derivative crosses the horizontal axis (dashed grey line) for the first time, which is 11-12 years for men and 18 years for women. Please keep in mind that the amount of data in this range is very limited and the exact number of years before the plateau is very noisy.
“The average climber reaches a plateau between 7c+ and 8a in around 11-12 years.”
Progression for different age
We all know that whichever activity or sport you do, the earlier you start in your life, the faster (or further) you progress. But how does it apply to climbing, and what does the data say about it? Let’s explore the field “date of birth” in the dataset to see at what age users from this dataset started climbing:
 |
|---|
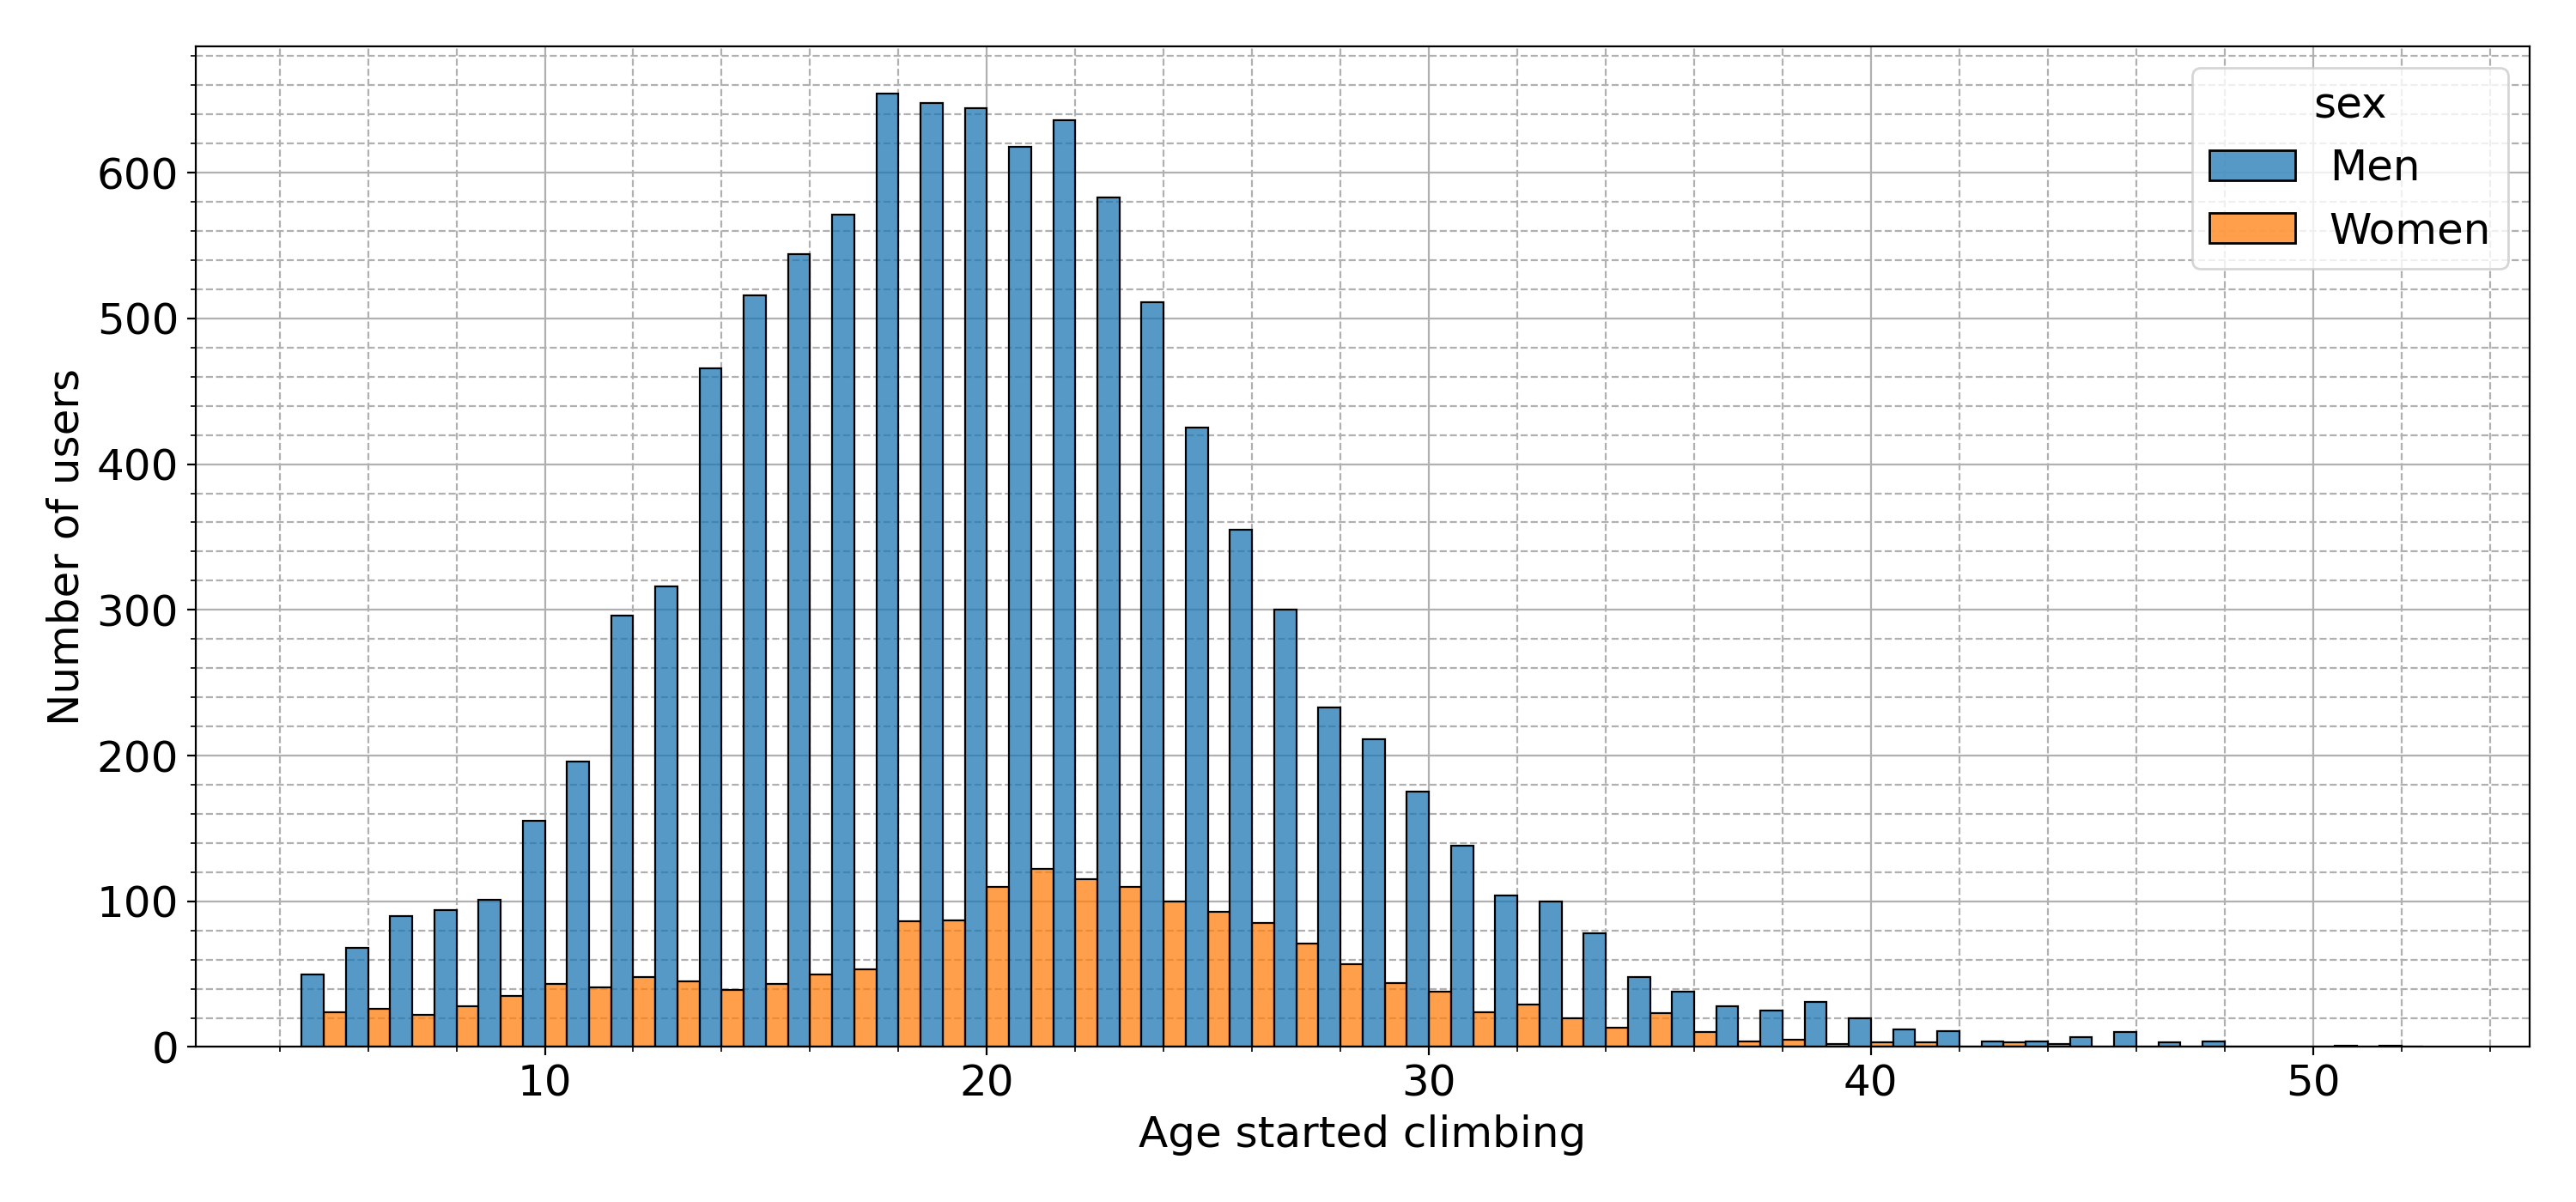
| Figure 9b Histograme of age at which users started climbing |
From the histogram, we can see that the majority of users started climbing between age 18-22, with the average men starting slightly sooner than the average woman. How does the age users start climbing affect the maximum grade they can achieve? Let’s look at a similar figure as the previous section, arranged this time by age group:
 |
|---|
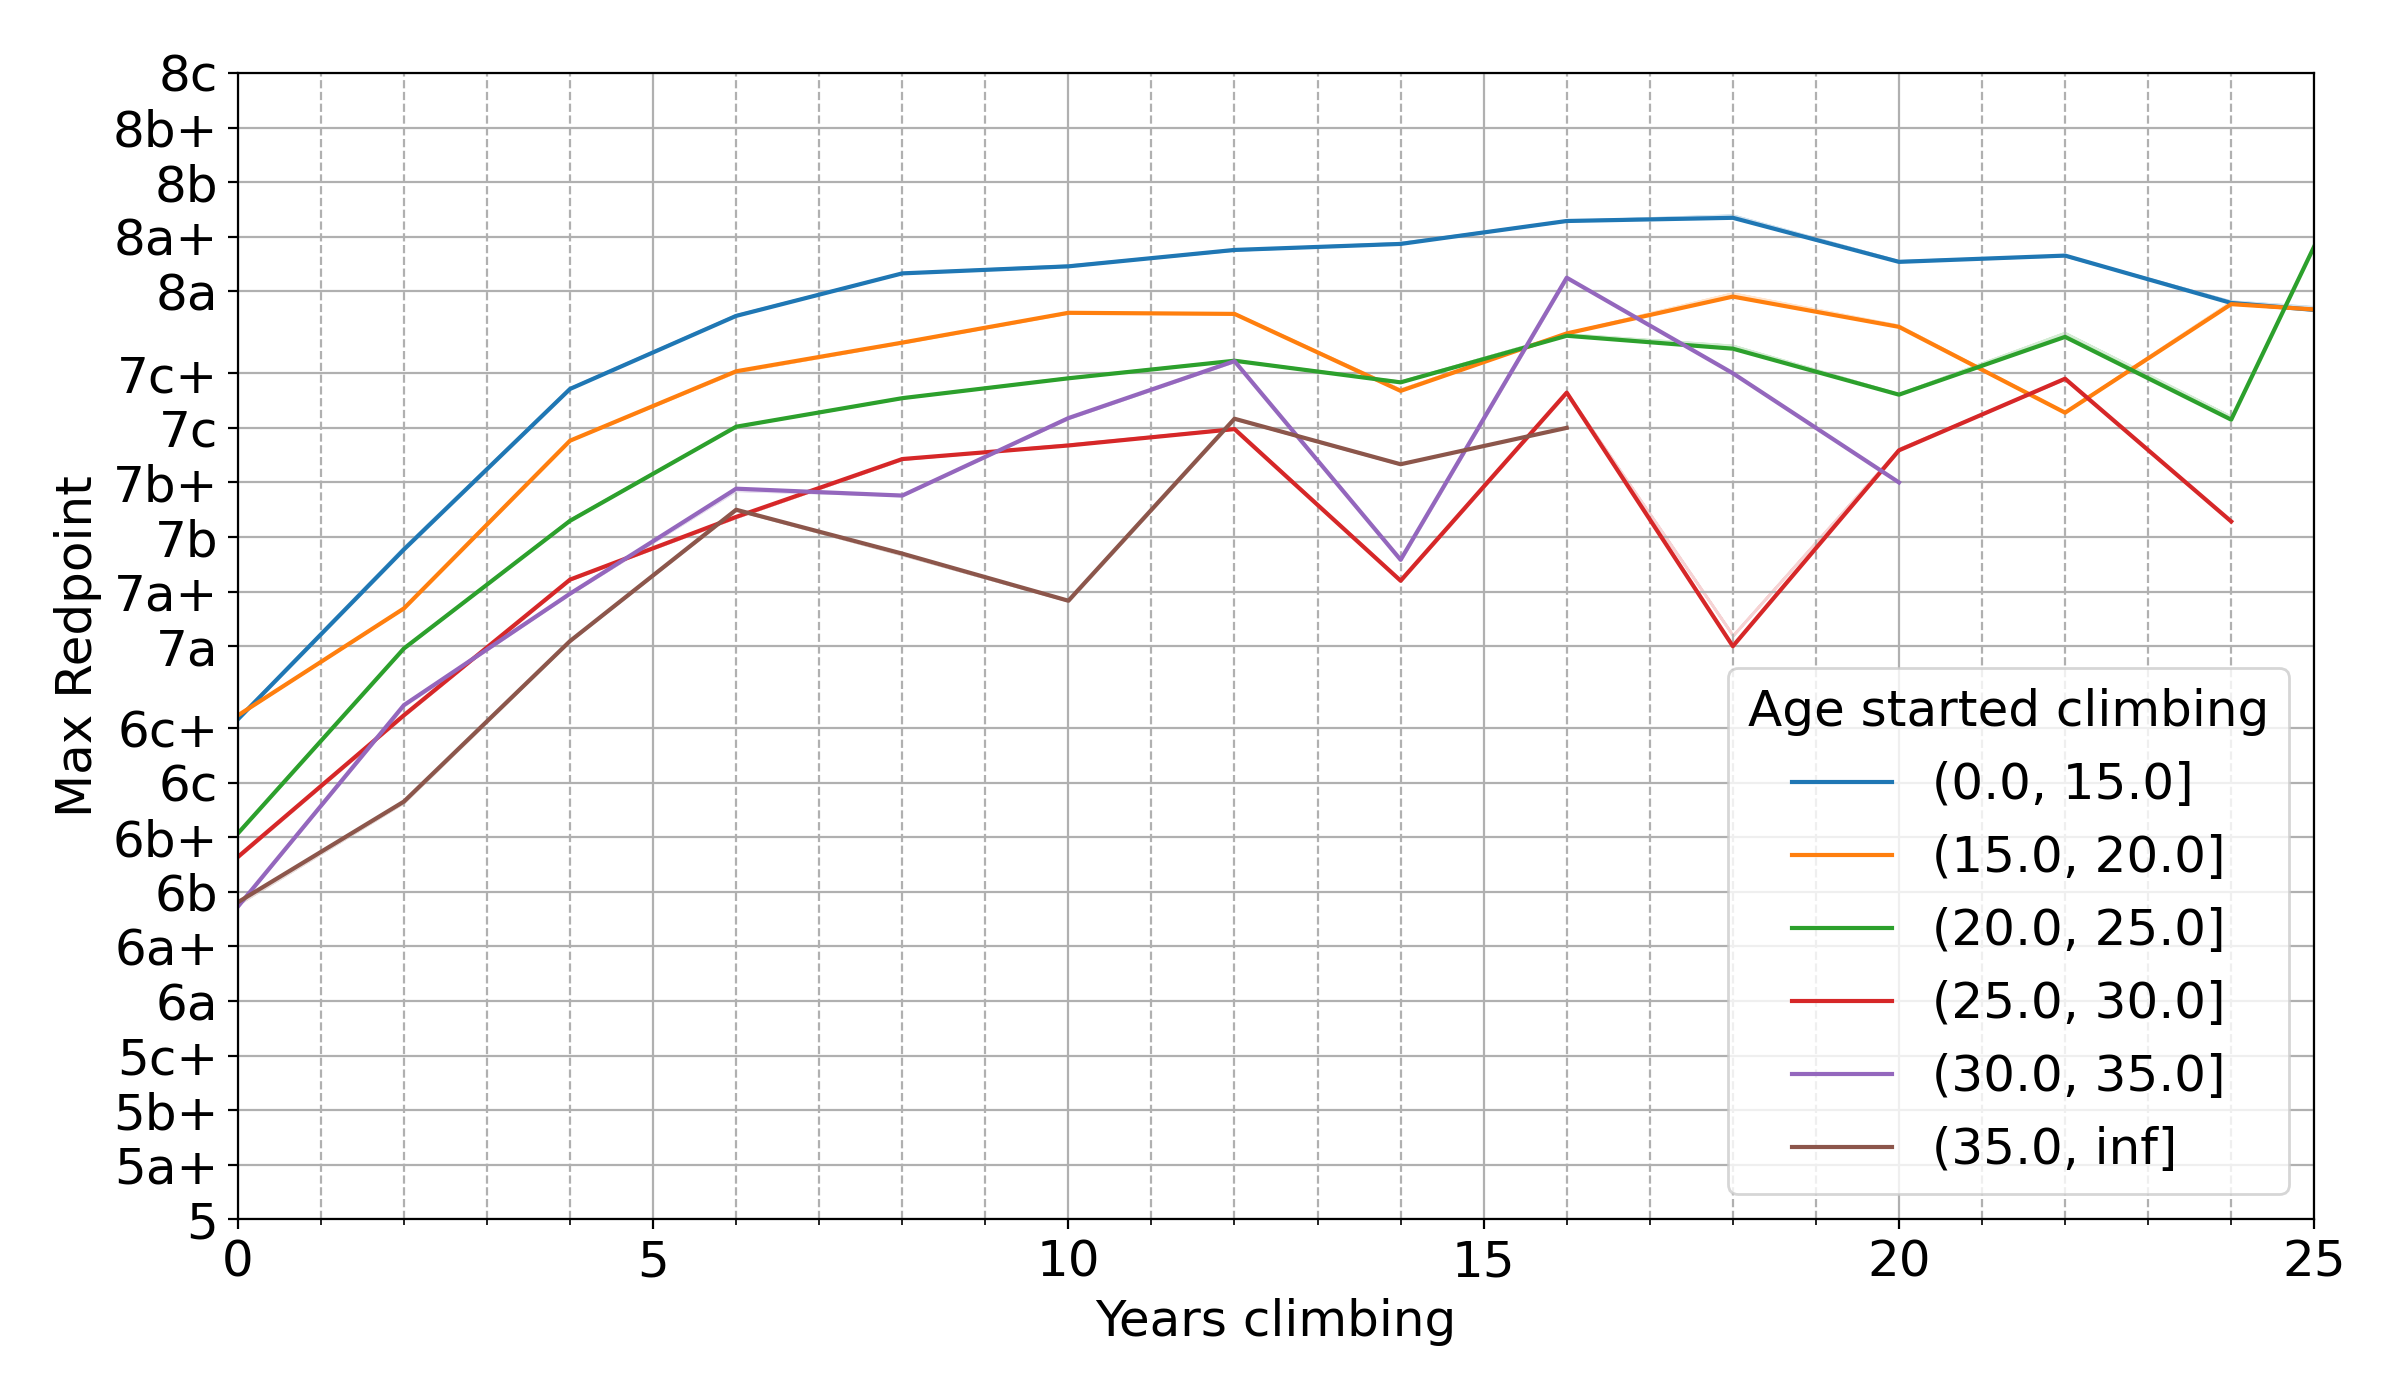
| Figure 9c Average maximum grade for different age groups vs years since they started climbing |
The plot gets noisier as the age started climbing and the grade increase, but we can clearly see a pattern. Climbers who start the earliest (age 0-15) not only start with higher grades, but they also achieve a higher maximum grade in their career, which is above 8a+. As the age users start climbing goes up, the maximum grade achieved goes down, with a max of 8a for age group 15-20, 7c+/8a for age group 20-25 and 7c/7c+ for climber who started later than 25.
What is interesting from this plot is that the progression curves for all the age groups seem to be parallel and simply shifted downwards as age increases. Kids will climb form 6c+ to 7c/+ (2.5 grades) in 4 years, while older climbers will improve from 6b to 7a+ (2.5 grades) in the same amount of years.
Progression for different height
An interesting parameter that is saved in the dataset is the users’ height. Unfortunately, only half of the users set the height in their profile, but we can try to get an idea of how height affects progress. For this analysis, it’s important to differentiate between men and women, since the distribution of height is different. However, due to the reduced amount of data for women (n= 2854), these results are not very reliable. I also restricted the analysis to sport climbing only because I didn’t have enough bouldering data to produce a clean plot. I broke down the height into three different categories by ensuring that each bin had equal number of users. For men, the breakdown of height produced three categories of 141-175 cm (short), 175-180 cm (medium) and 180-216 cm (tall).
 |
|---|
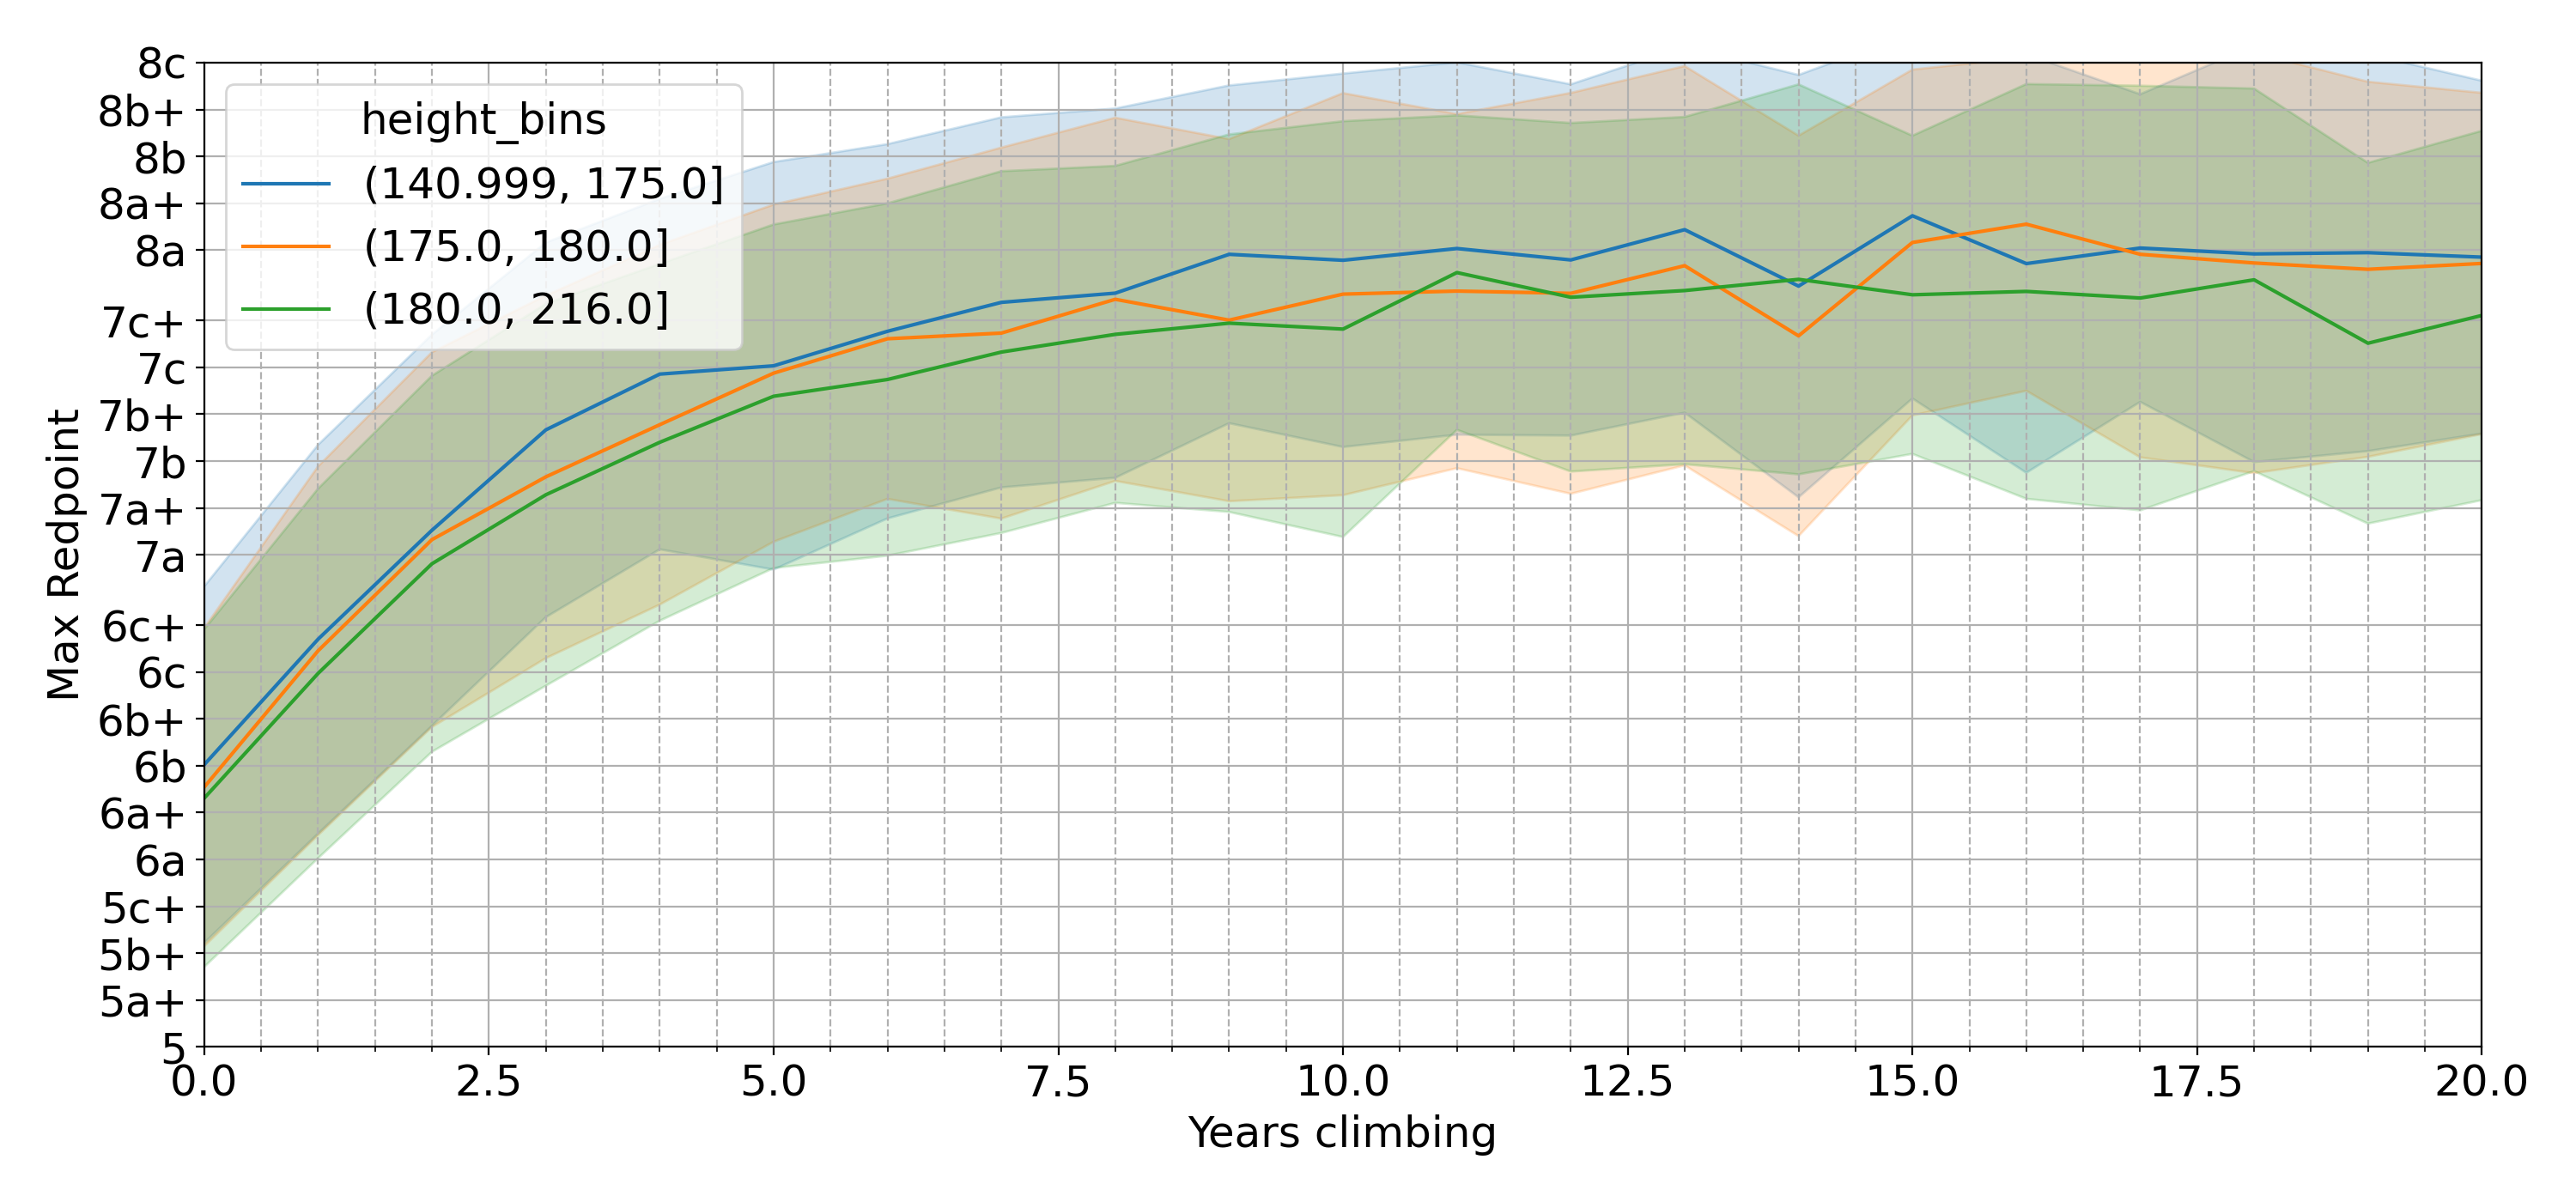
| Figure 10 Average maximum grade for men clustered by height vs years since started climbing |
From this plot, we can see that short climbers seem to be the ones that progress faster, with medium climbers in the middle and tall climbers progressing the slowest. The data, however, is very noisy and it’s difficult to draw any valuable conclusions.
“Men that are 141-175 cm tall seem to progress slightly faster than men that are 180-216 cm”
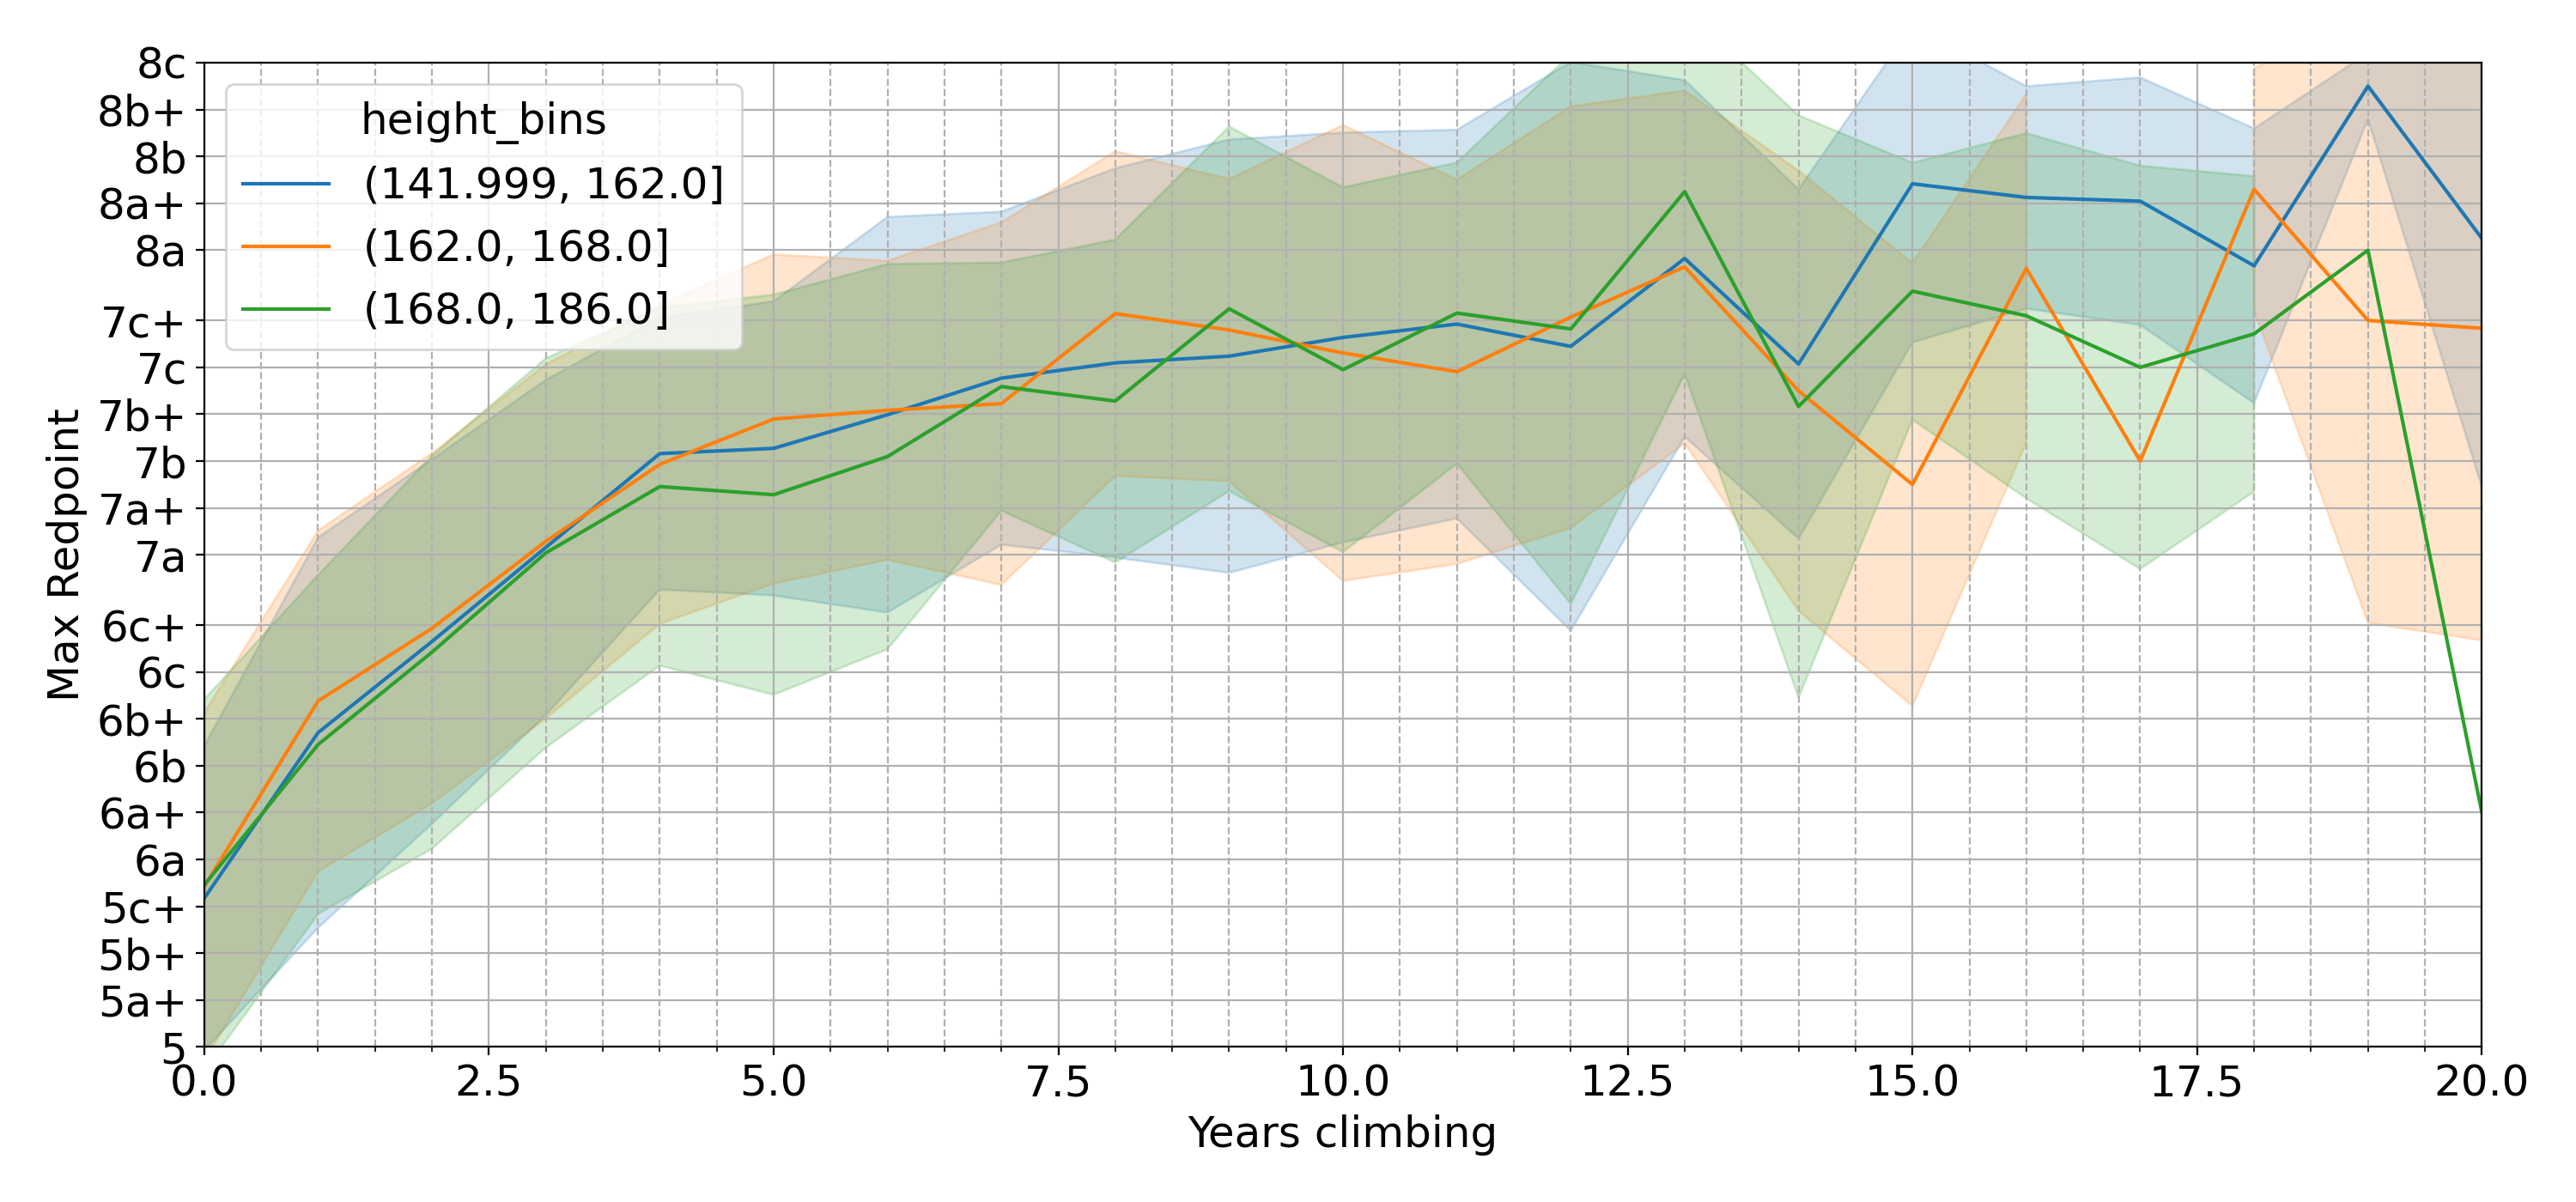
For women, the height bins were 142-162 cm (short), 162-168 cm (medium) and 168-186 cm (tall).
 |
|---|
| Figure 11 Average maximum grade for women clustered by height vs years since started climbing |
The plot is even noisier than for men, due to the reduced amount of data. It’s impossible to draw any conclusion but I’ll leave it here for completeness.
Maximum grade for different height
Instead of looking at the progression of climbers for different heigh groups, we can try to estimate the average maximum grade sent by climbers grouped by age. For this analysis, I reduced the precision of height to 5 cm (150, 155, 160, etc.) and calculated the average maximum redpoint for each height.
 |
|---|
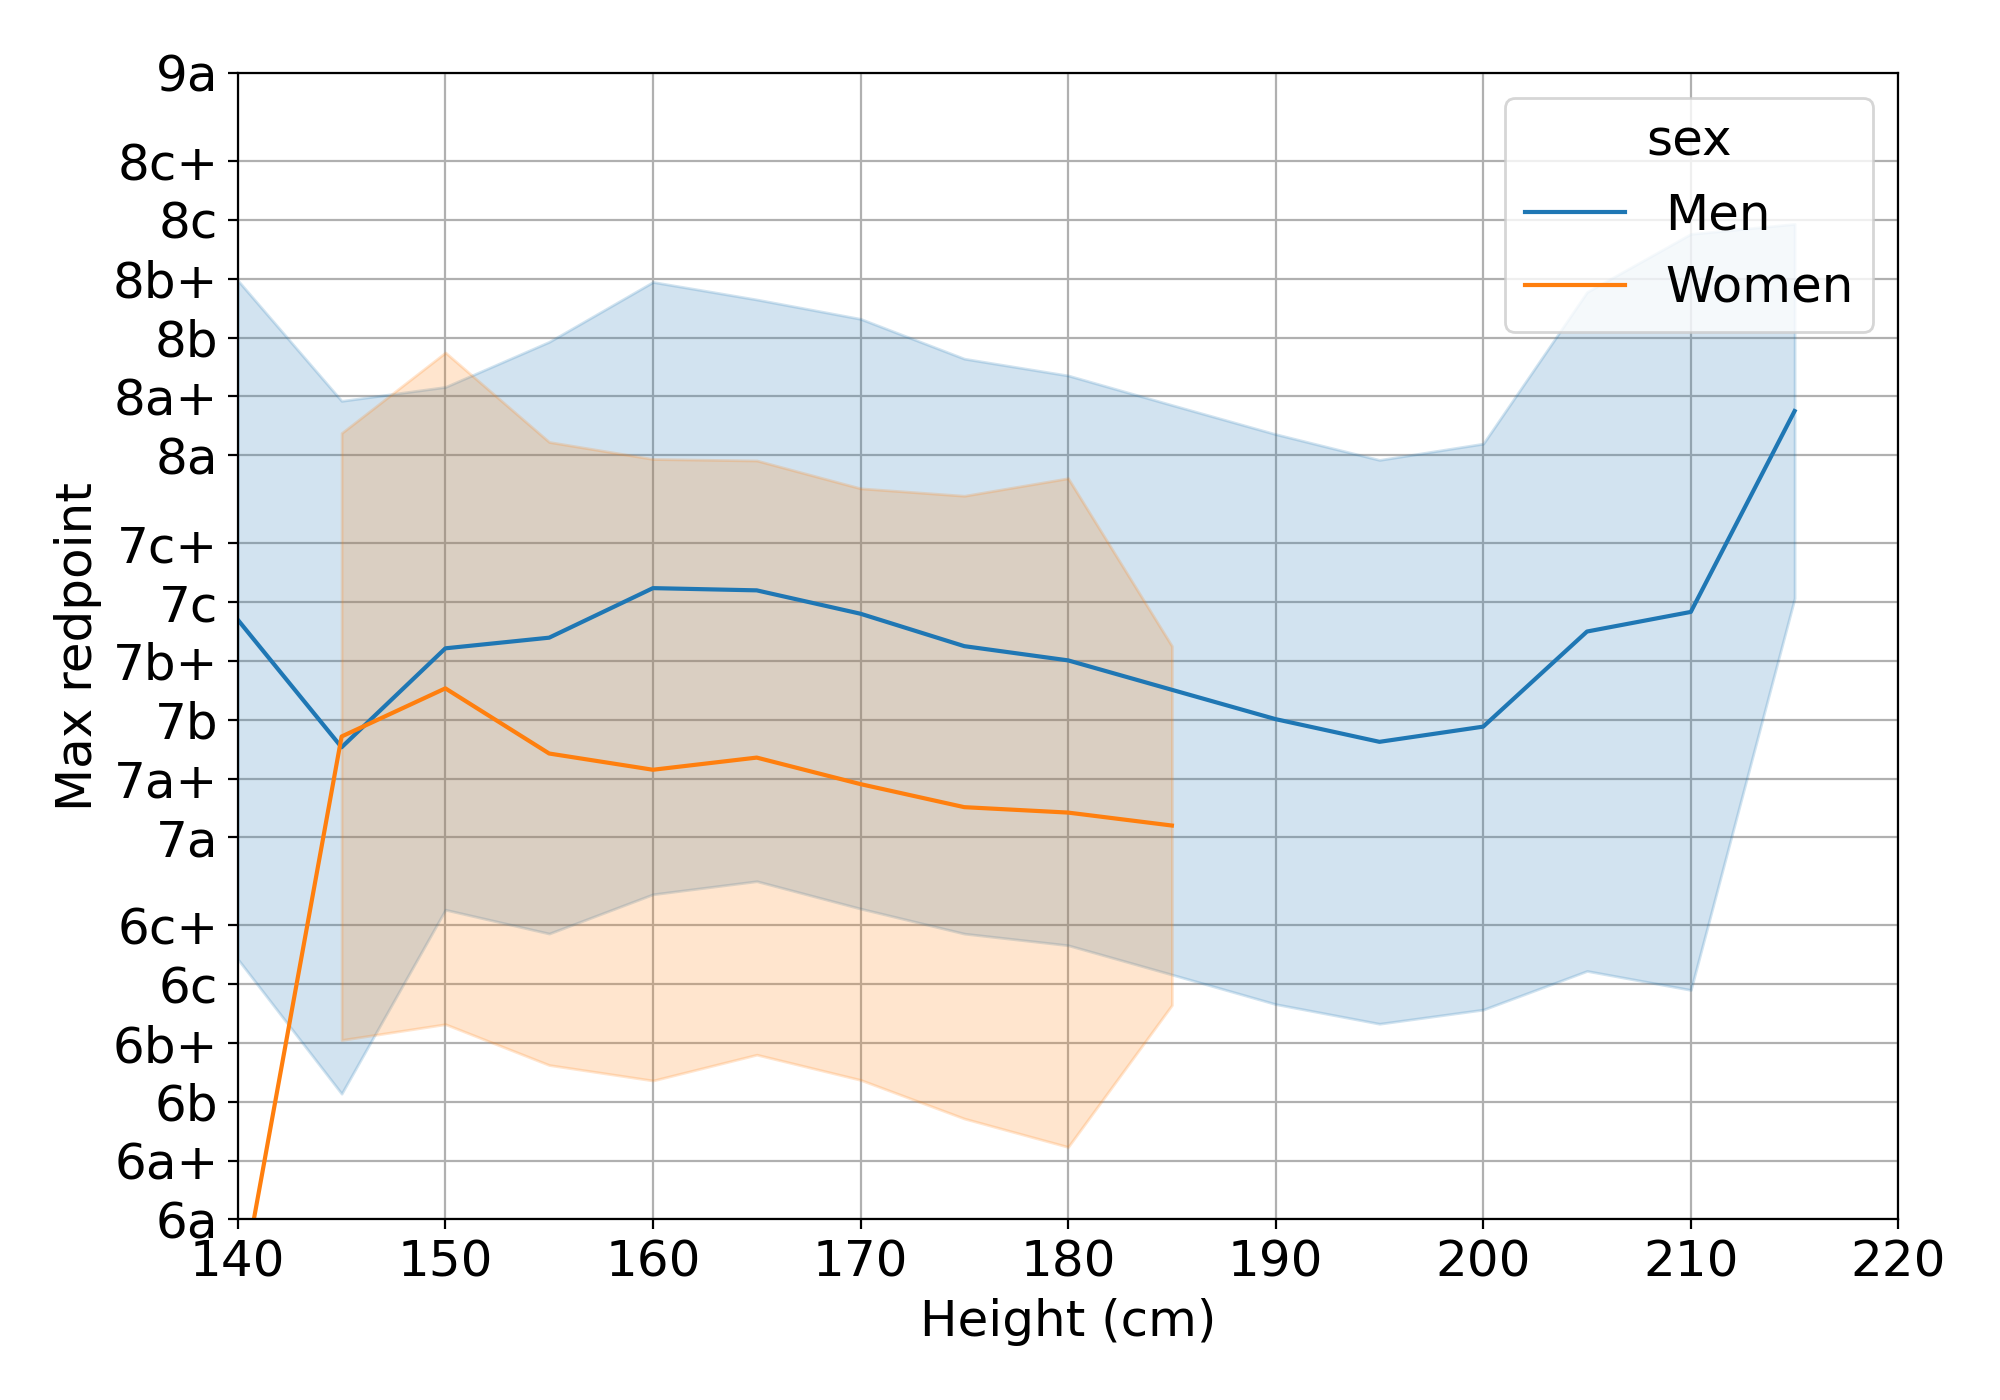
| Figure 11b Average sport grade for men and women, aggregated by height |
The results are still very noisy but we can see that there’s a correlation between height and the maximum redpoint. Men that are shorter than 150 cm and taller than 180 cm seem to climb the worst, although climbers taller than 210 cm reach the highest max redpoints. If a route is 8a because of a difficult crux and a very tall climber can skip it by reaching for the next holds, I can imagine how very tall climbers show higher average grades. Excluding very tall (>200 cm) climbers, the best height for men seems to be between 160-170 cm. For women, the data is more noisy, but we can see that 150 cm seems to be the best height, with the maximum grade going down with height from there on.
“Men that are between 190-200 cm seem to be the most negatively affected by height. The best height seems to be between 160 cm and 170 cm.”
Please note that these results refer to the maximum redpoint for each individual user, whichever the route they climbed. However, the same route could feel like a 7a for a tall climber and 7b for a short one, and the other way around. Also, keep in mind that correlation doesn’t mean causation and trying to understand how height affects climbing is a topic for a different article.
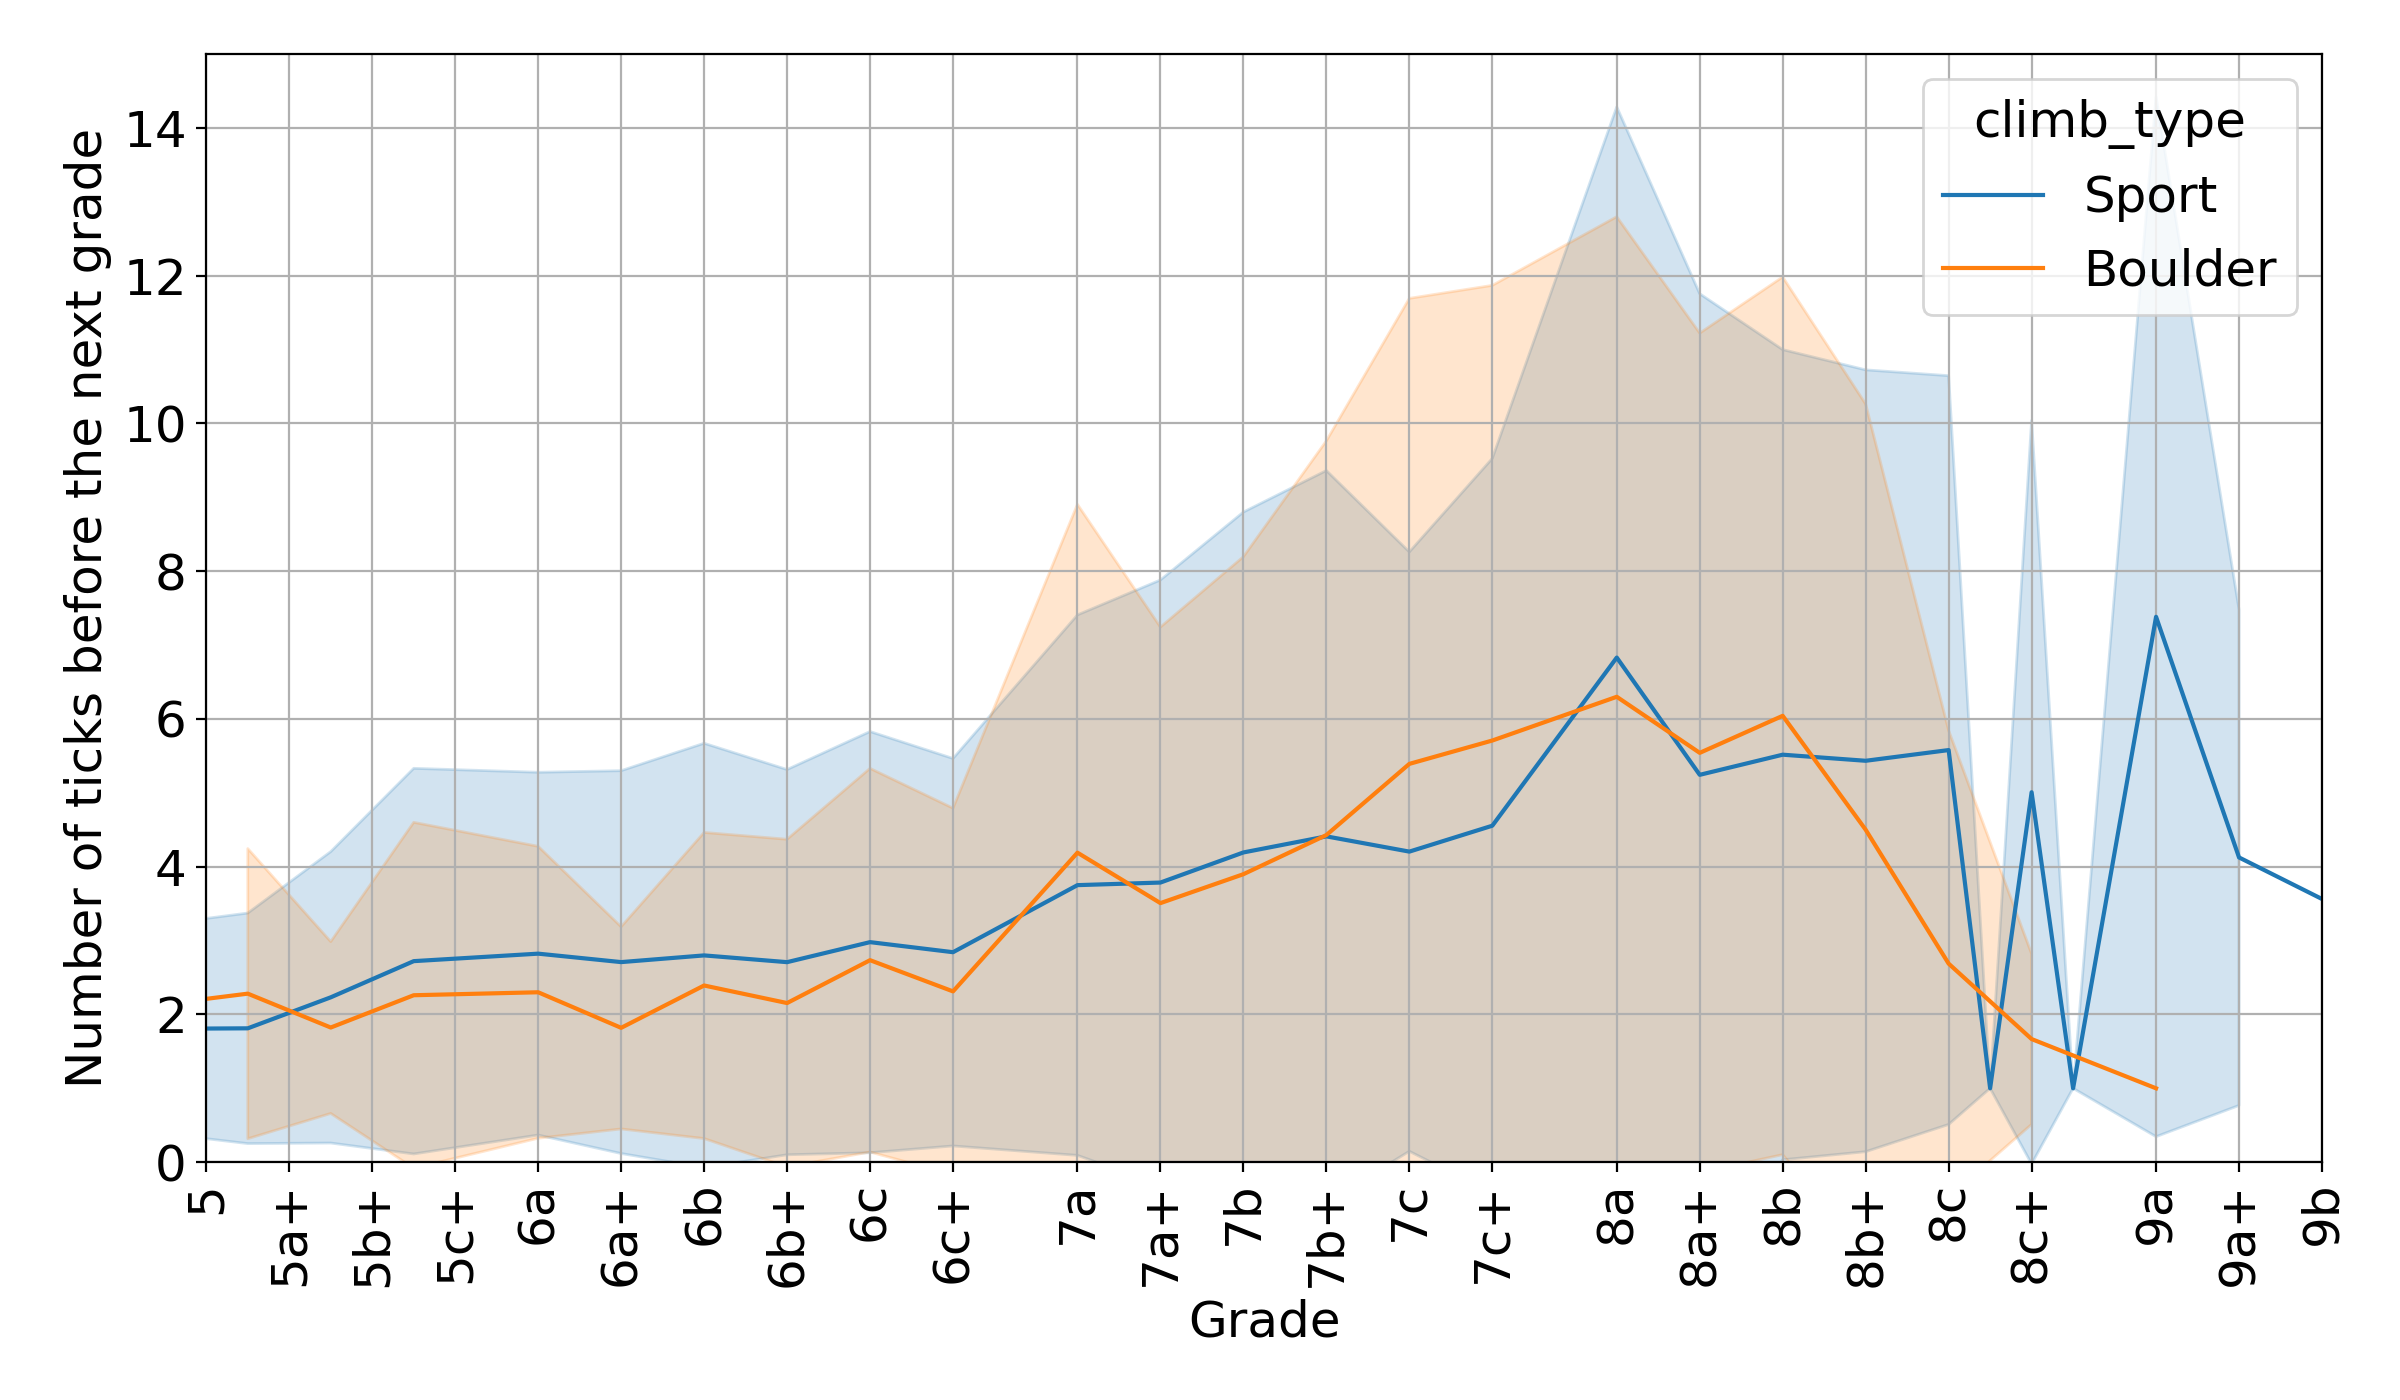
Number of ticks before the next grade
We spoke a lot about progression through grades in terms of time, but a different way to measure progression is through the number of individual ascents for a certain grade. The question I want to answer is: “How many routes are you expected to climb at your maximum grade before climbing the next grade?”. To answer this question, we’ll use a similar approach to “Max grade per user” mentioned before in this article. However, instead of selecting the maximum grade for each user, we select the second highest grade for each user and we count the number of occurrecies of that grade per user (thank you StackExchange). If we average the number of ascents or “ticks” for each grade, we obtain the following plot:
 |
|---|
| Figure 11c Average number of ascents for a certain grade before climbing the next grade |
The figure shows a similar behaviour for sport climbing and bouldering. Say that your maximum sport grade is 7a and you want to know how many 7a to climb before being able to climb a 7a+. According to the plot, on average, the answer is 4. Keep in mind that this data was calculated based on climbers that do climb the next available grade. This means that climbers that did climb up to 7a+ climbed, on average, around 4 7a routes before climbing 7a+.
If you can climb between 2 and 6 routes of a certain grade you can expect to be able to climb the next grade.
Secondary analyses
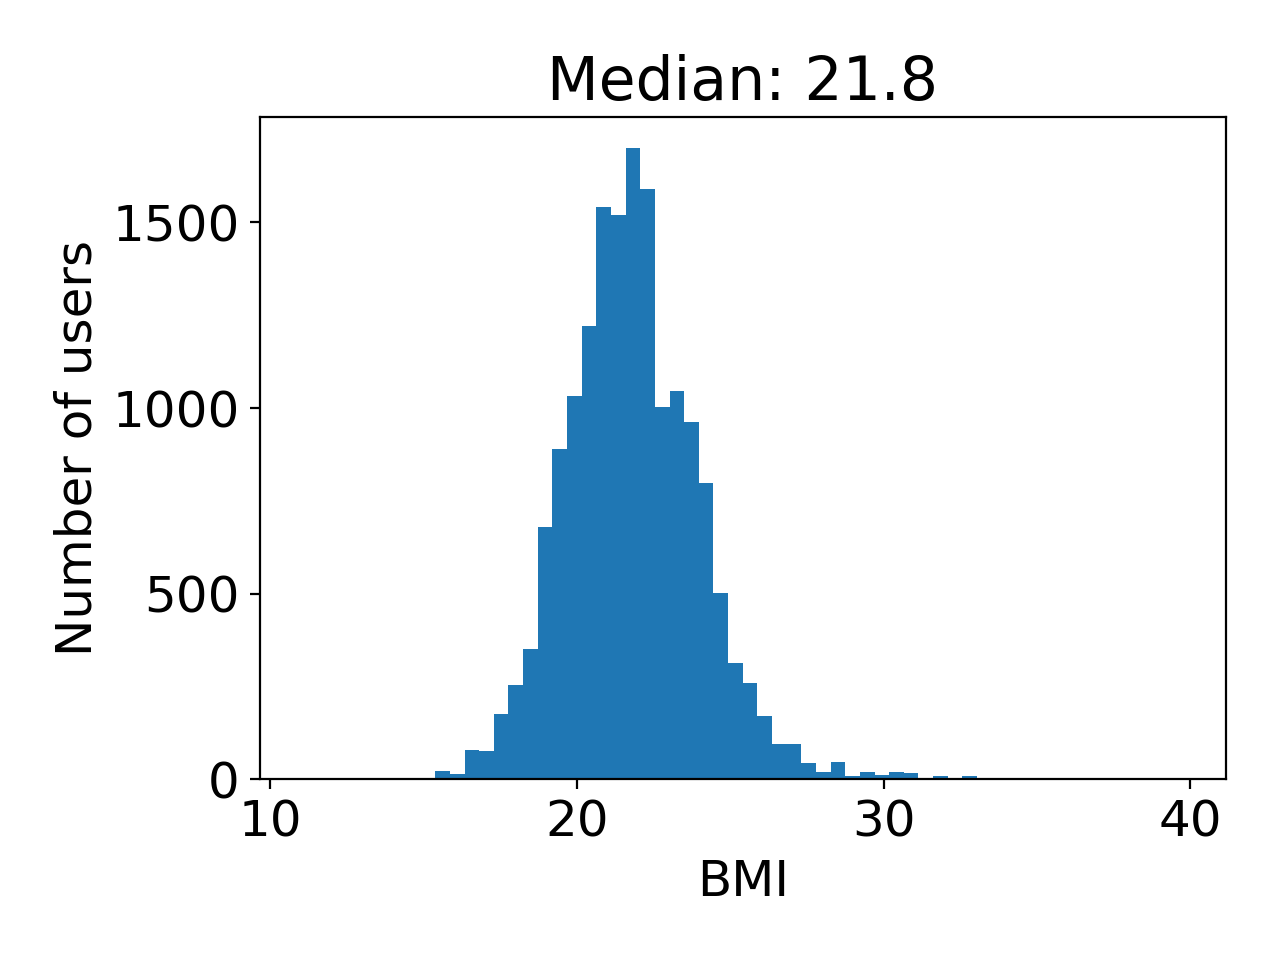
Analysis of BMI
In addition to height, some of the users also have weight saved in their profile, which allows us to calculate their BMI (weight [kg]/height [m]2). If we plot the histogram of BMI for all the users, we can see that is almost normally distributed, with an average BMI of 21.8 and standard deviation of 2.27.
 |
|---|
| Figure 12 Histogram BMI for all climbers in the dataset |
A healthy range for BMI is between 18.5 and 24.9, so it’s good to see that the majority of climbers are in a healthy range.
Using the same approach as the rest of this article, we can group users by the maximum grade they’ve ever sent and plot them against their BMI. Using this strategy, we can see if there is any correlation between BMI and maximum redpoint grade.
 |
|---|
| Figure 13 Average BMI for men and women vs maximum redpoint grade |
From the plot, we can see that the average BMI correlates well with the
maximum redpoint, with the curve having a similar trend for men and
women. The correlation seems to be stronger for men (Pearson's r =
-0.190, p < 0.001) than for women (Pearson's r = -0.113, p < 0.001).
Since weight in climbing is quite a sensitive topic, I’d like to remind the reader that these measurements are averages, with very large error bars on top of them. This means that although the average climber has a specific BMI, you can have pretty much any BMI within the healthy level and still climb pretty much any grade.
Countries
Using the “country” entry from the dataset, we can select the max grade ever climbed by each user and cluster them by nationality. This will allow us to tell which country climbs the hardest in the world! For sport climbing:
 |
|---|
| Figure 14 Average maximum redpoint grade for sport climbing by country |
the strongest sport climbers in the world are Japanese, followed by Korean and Singaporean.
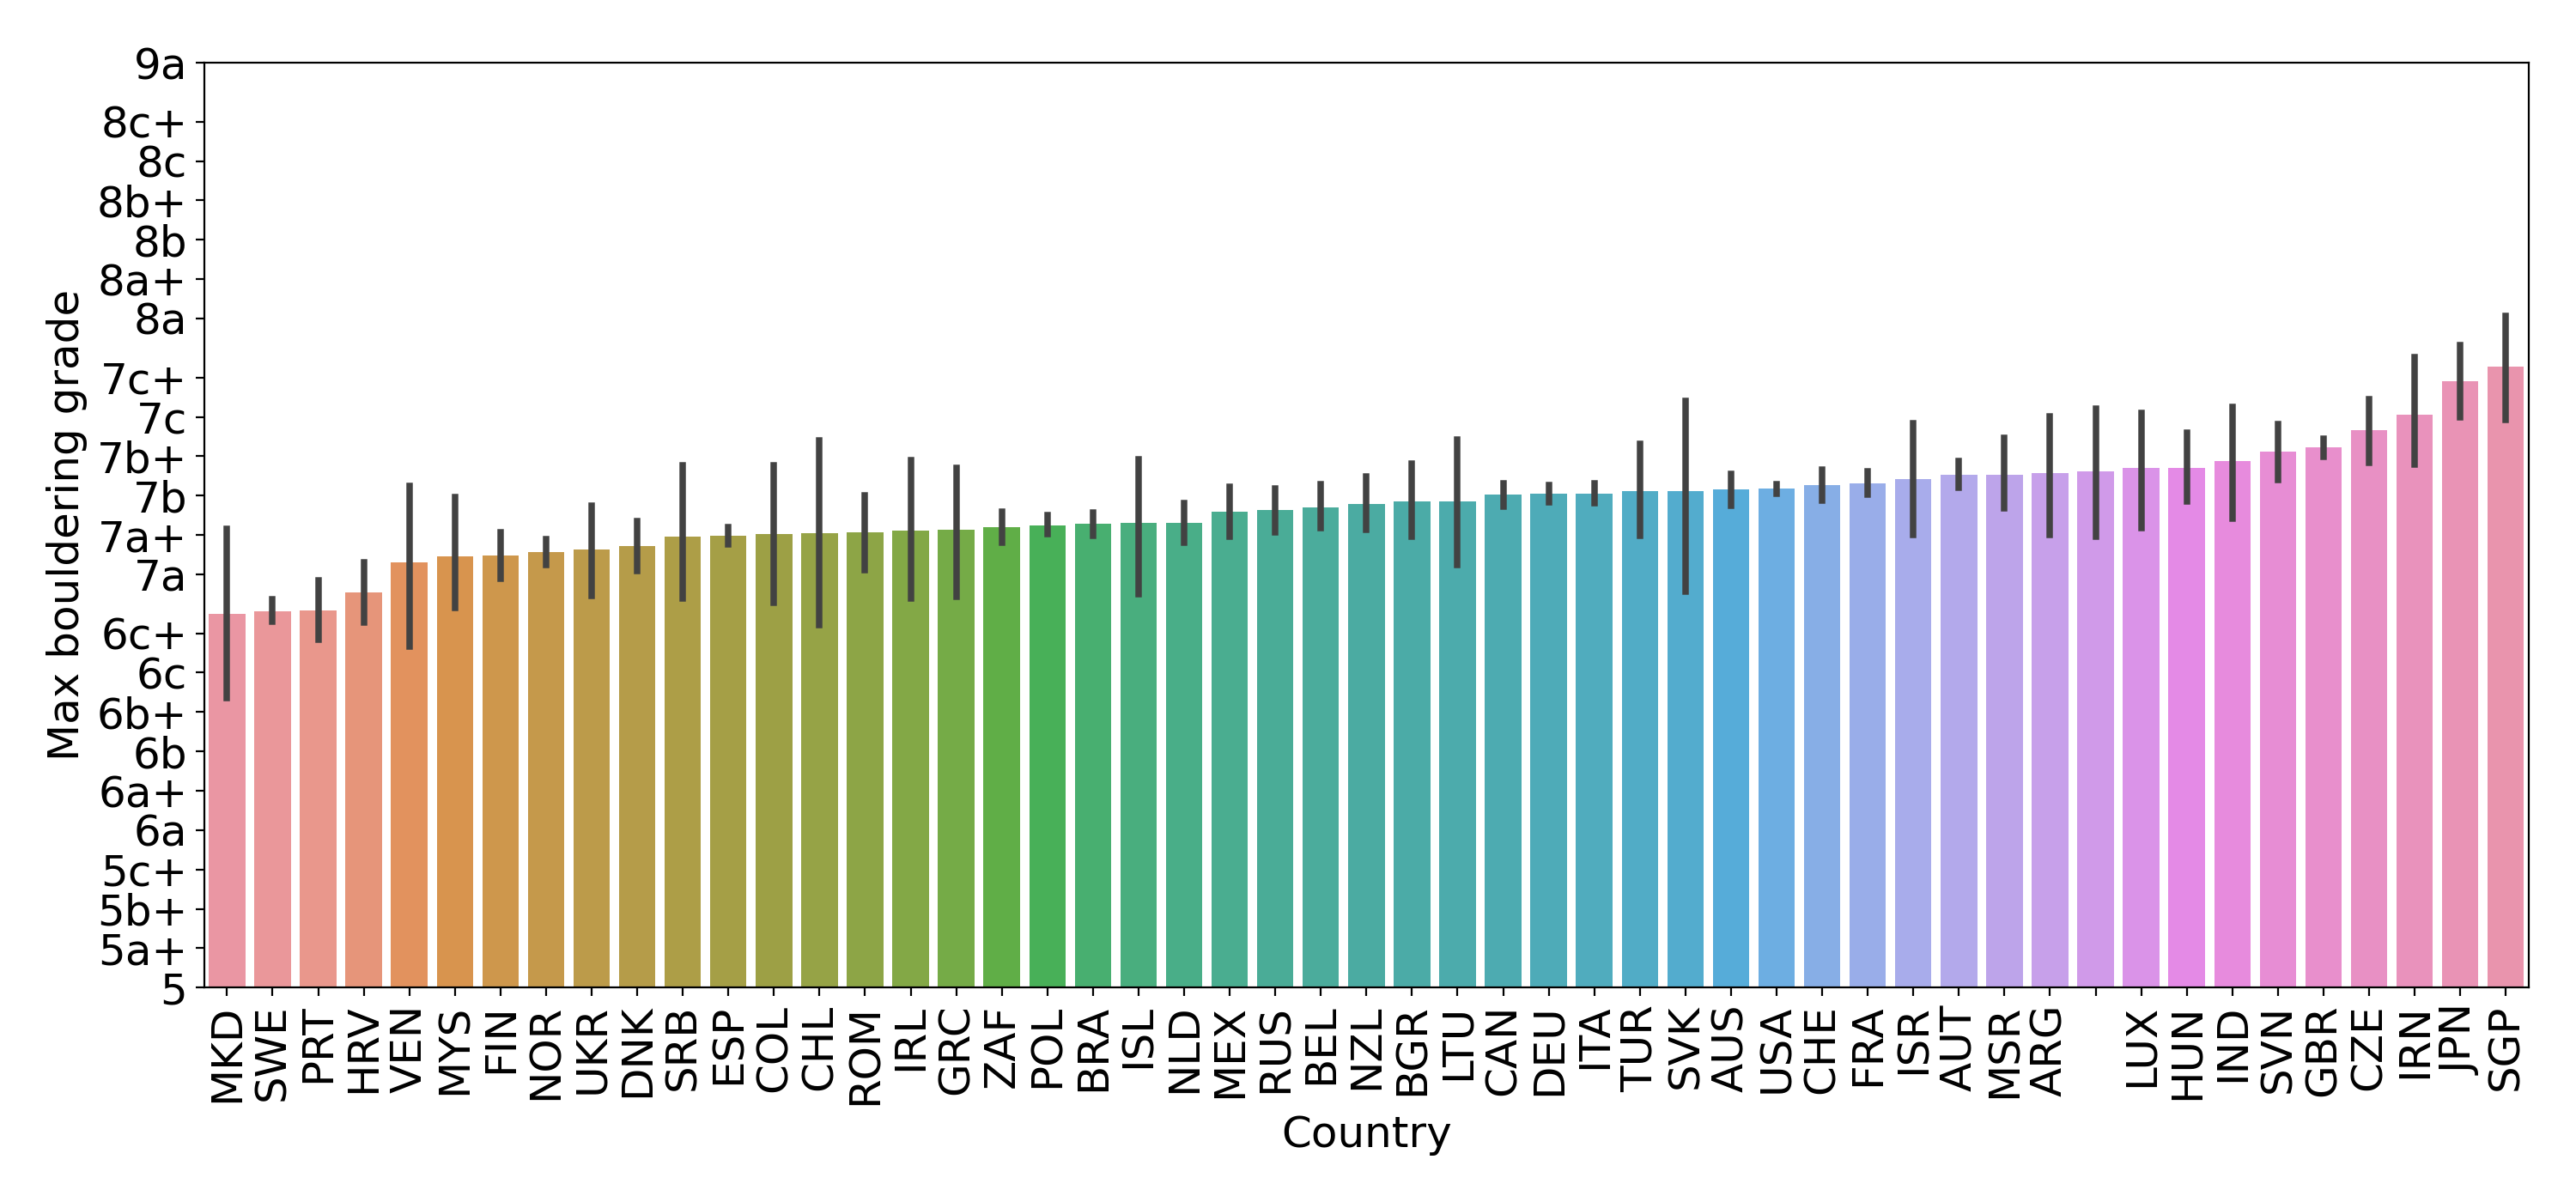
For bouldering:
 |
|---|
| Figure 15 Average maximum bouldering grade by country |
the strongest boulderers are Singaporean, followed by Japanese and Iranian.
Occupation
The last type of analysis that I decided to run on this dataset concerns the occupation field that is available for each user. I selected all the users that had a non-empty occupation field, counted the occurrences of each and kept only those that appeared at least twice. I then generated a text document where each word was repeated the square root of their occurrence, separated by a comma. I fed this document into a word cloud generator and obtained the following picture:
 |
|---|
| Figure 16 Word cloud generated with occupation field from the dataset |
Some of the elements are actually the same occupation with different words or in a different language, like “students”, “estudente”, “university students” or “grad students”. There are also a ton of engineering positions who, if they’re like me, they probably just love logging and data…
Limitations
To conclude, I want to talk about some of the limitations of this article. (1) Beginners don’t really log their ascents. When you get into climbing, logging ascents is not really one of your priorities. As you improve and get stronger, you start having an interest in metrics and progression, which is when you probably start logging. This means that lower grades and not very well represented in this analysis. On top of that (2) strong climbers often don’t bother logging lower grades. I know this because most of my friends are like that, they only log ascents that they think are “log worthy” and this only exacerbates this limitation. (3) Some people logged only one or two ascents in the entire dataset. (4) Climbers often take breaks, and these are not recorded in the dataset. These long breaks can be very long and add noise to the variable “Time required to climb a grade”. (5) All the ascents logged in this dataset refer to outdoor climbing only.
I would also like to stress that this article is very different from a normal scientific article that I would usually work on. Typically, I would do a literature review, work with a team, discuss research strategies and double check results with other experts in the field. This article, since I wrote it in my free time, is mostly just a personal project that I decided to run in my free time. There could be mistakes in the way I interpreted the data, or errors in the way I processed it and bugs in the code. If enough people think it’s interesting and I have the time, I might turn this into an actual publication at some point. If you’re interested and you would like to collaborate on this, or also to share some feedback, please get in touch.
Appendix
A1 - Table of grades
The following is a table version of the plot depicted in Figure 2. The first column is the grade you want to climb, the second column is the maximum flash/OS grade you need to send and the third column is the grade you should be able to flash/OS consistently.
| Max Redpoint | Max Flash/OS | Average Flash/OS |
|---|---|---|
| 6a | 6a | 5b+ |
| 6a+ | 6a+ | 5c |
| 6b | 6a+/6b | 5c+ |
| 6b+ | 6b | 6a |
| 6c | 6b/+ | 6a |
| 6c+ | 6b+/6c | 6a/+ |
| 7a | 6c | 6a+/6b |
| 7a+ | 6c+ | 6b |
| 7b | 6c+/7a | 6b/+ |
| 7b+ | 7a/+ | 6b+/6c |
| 7c | 7a+ | 6c |
| 7c+ | 7b | 6c/+ |
| 8a | 7b/+ | 6c+/7a |
| 8a+ | 7b+/7c | 7a |
| 8b | 7c/+ | 7a+ |
| 8b+ | 7c+/8a | 7a+/7b |
| 8c | 8a | 7b/+ |
| 8c+ | 8a+ | 7b+/7c |
| 9a | 8a+/8b | 7c/+ |
| 9a+ | 8b+ | 7c+/8a |
A2 - Historical progression
In this article, to calculate the grade progression I considered the maximum grade that each user has sent, together with the time it took them to climb that grade. This produces one single datapoint per user. However, for each user, I can extract much more data than that. I know when they climbed their first 6a, their first 6b and so on, so that each user becomes as many datapoints as the grades they’ve sent.
Here is the strategy: for each user in the dataset, I have all the grades they’ve ever climbed with a date of when they sent each one. If I group the data in combinations of
(user, grade), I can pick the minimum date (i.e. the first time) a user
sent that specific grade. For example, (Adam, 6a, 2006), (Adam, 6a,
1999), (Adam, 6a, 2009) becomes (Adam, 6a, 2006). Knowing the year that
each user started climbing, I can easily calculate how long it took each
user to climb a specific grade, and averaging through the grades will produce the
average number of years required to climb each grade.
In theory, this approach makes sense. In practice, it doesn’t. The problem is that not every user climbs every grade in a progressive fashion. Think of the first time you climbed your first 5 and the first time you climbed your first 3. Chances are, you climbed the first 5 in less than a year and your first 3 many years later (simply because you didn’t come across one!). Another issue is that strong climbers don’t really bother logging (climbing?) lower grades, introducing additional noise in this measurement. For these reasons, the progression plot produced with this method was very noisy and unreliable for grades below 7a, so I decided to keep it out of this analysis. If you still want to see it, you can find it in this repo (that I publish at some point).
A3 - Progression of men vs women
In the main article, we showed the average progression of men and women
is different over the years. When we process those plots, we need to
average the data in one dimension, either the grade (clustering years)
or the years (clustering grades). This process necessarily reduces the
amount of information presented by the plot and can create some
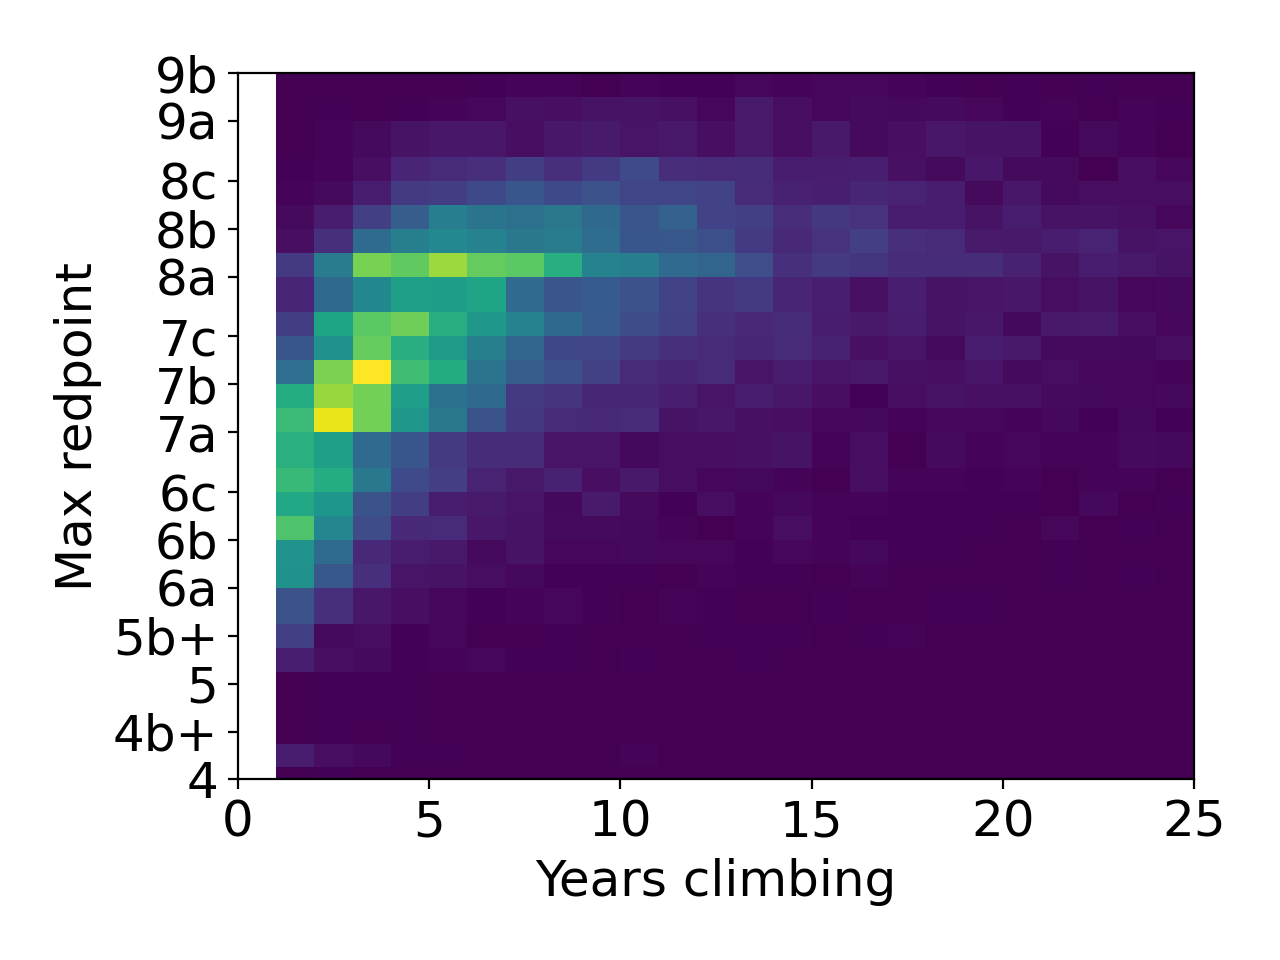
misconceptions. A better approach to visualise the data, which is far
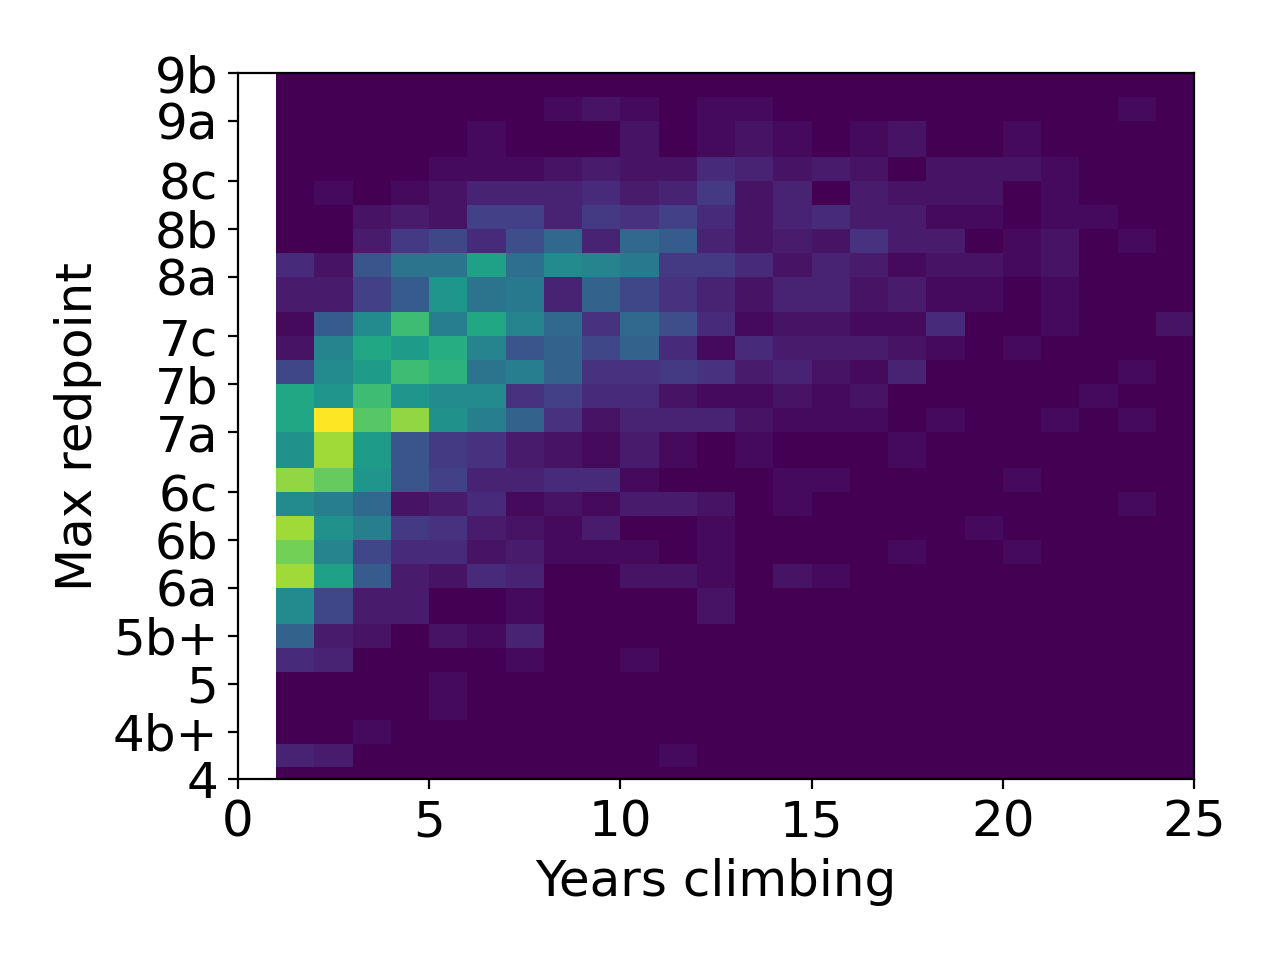
more complicated to read, is to look at the 2D histogram of grades/years
for both men and women. The 2d histogram considers all the pairs
(grade, years climbing) and counts how many occurrences are in the data
for each pair. We can do this both for men:
 |
|---|
| Figure 17 2D histogram of maximum grade vs years climbing for men |
And women:
 |
|---|
| Figure 18 2D histogram of maximum grade vs years climbing for women |
Both images are normalised so that the yellow colour is the most number of occurrences, while blue is the least. To get a better idea of the comparison between men and women, we can plot the two images next to each other, men on the left (flipped left to right for clarity), and women on the right.
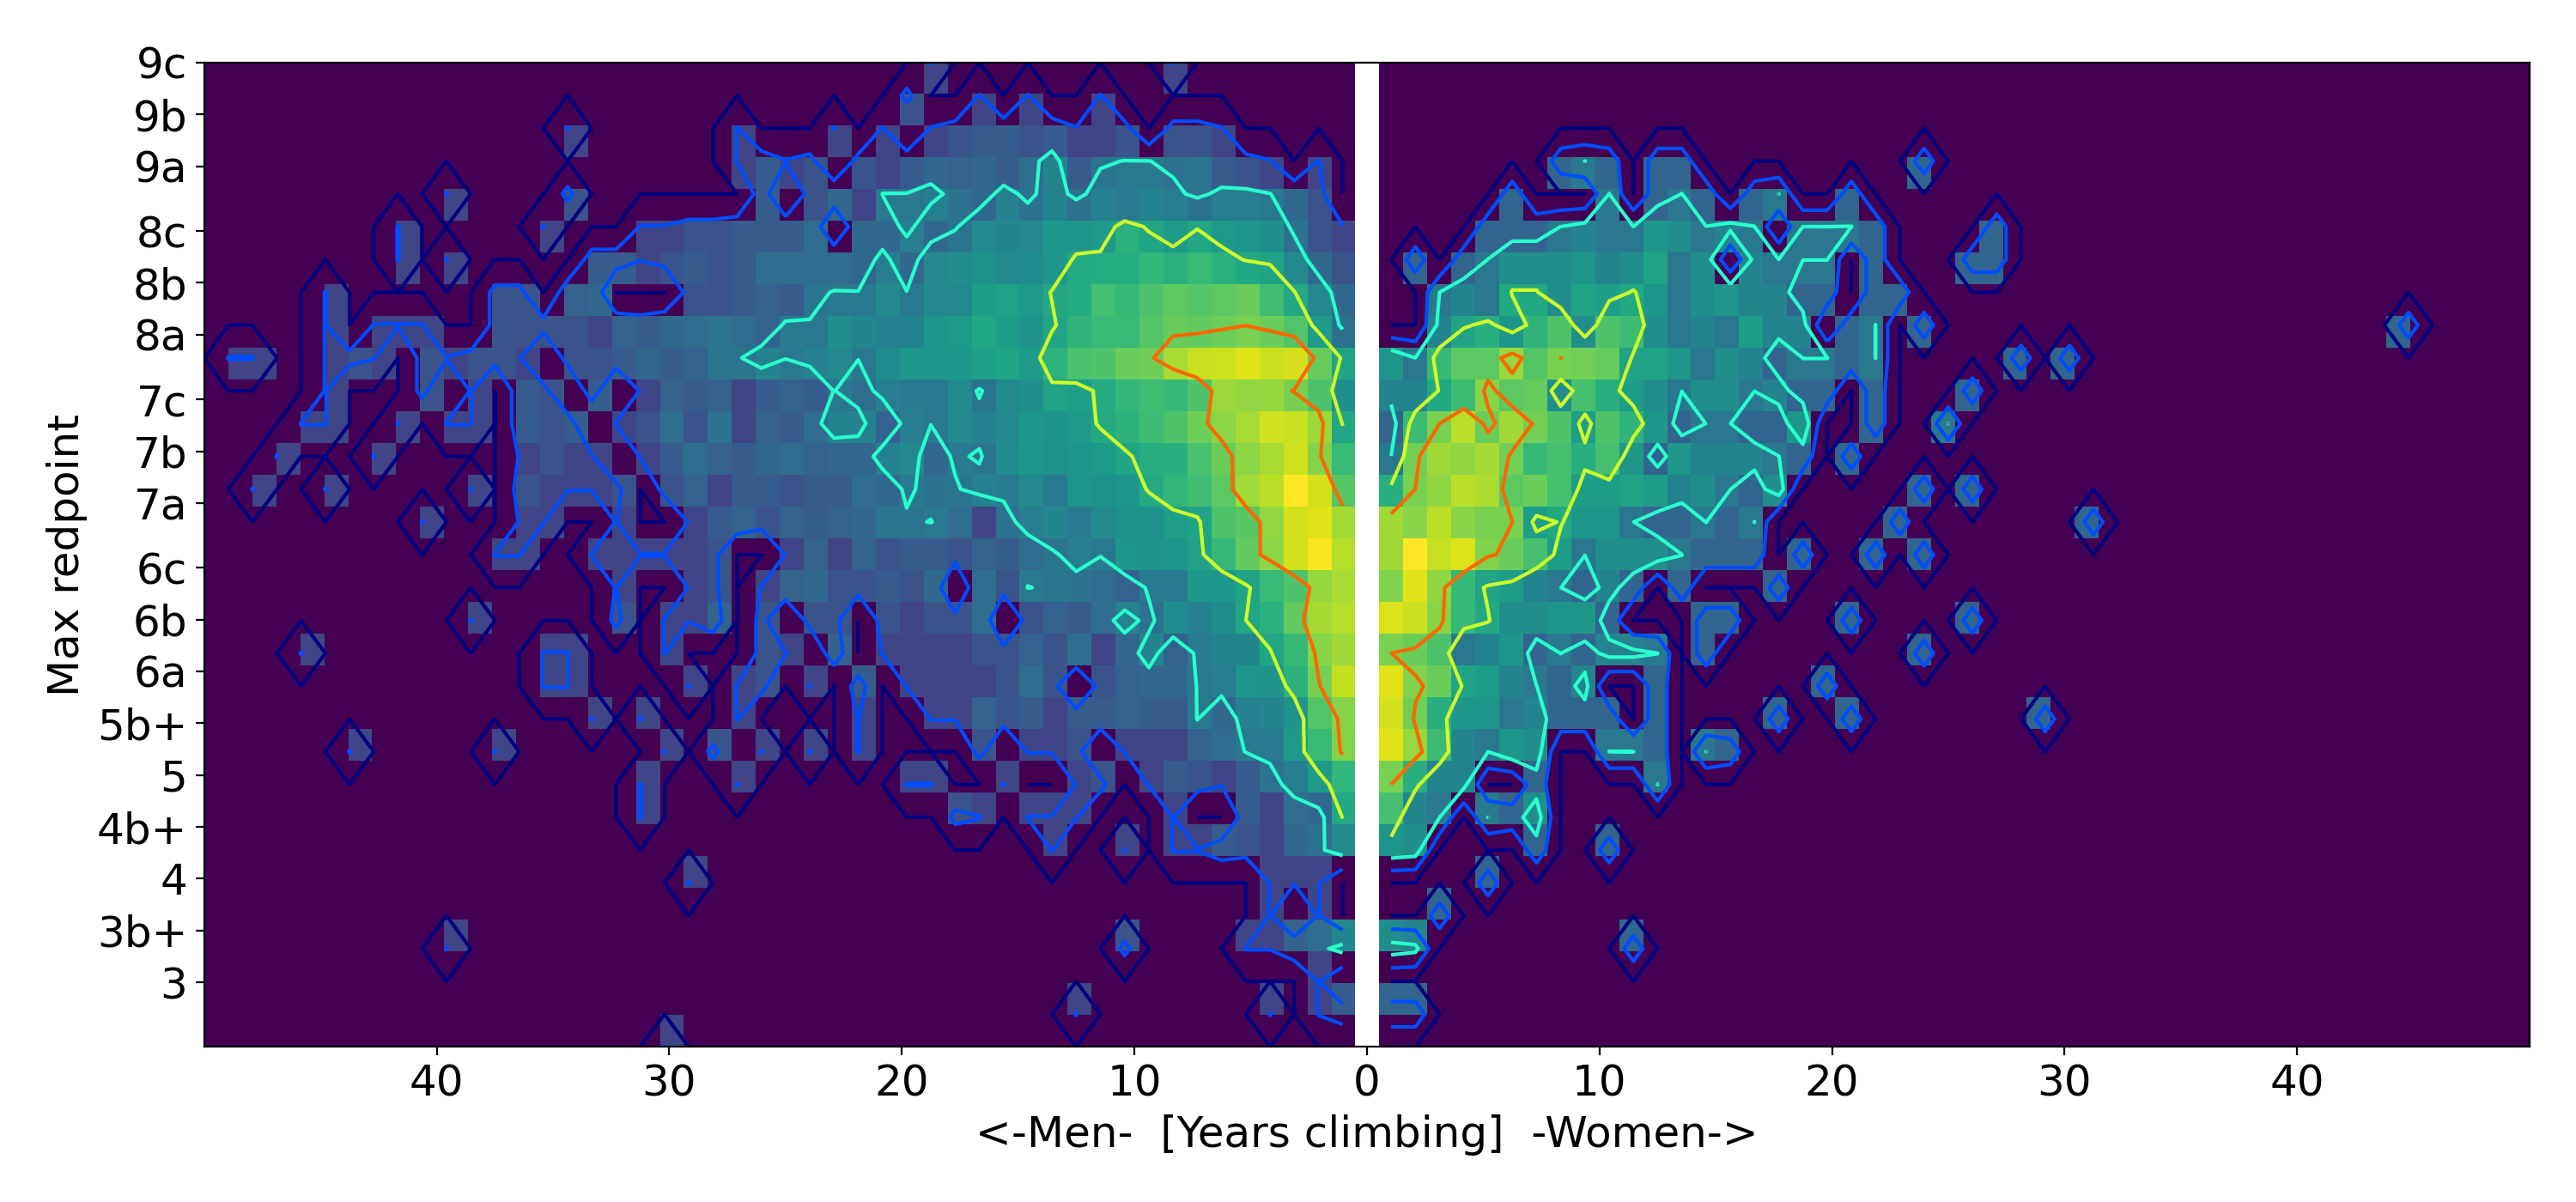 |
|---|
| Figure 19 Combination of Figure 18 and 19 with contour lines |
To plot this image, I first applied a gamma (0.3) correction to the distribution and then calculated the contour lines, or iso-occurrence lines, to highlight similarities between men and women. From this plot, we can see that the finding from the main section on the comparison between men and women make perfect sense. If we choose a value on the x-axis, for example 5 years, we can see that there are more men that climb harder grades in the 8a range than women, as confirmed by the orange contour line that goes higher for men than for women. This is in agreement with the results of the main section where we showed that the average male climber climbs harder than the average women climber who has been climbing for the same number of years.
The plot from the main section, however, also showed that for a specific grade (say 6b), the average women climber requires slightly less (2.5 years) than the average man (3 years) to achieve the same grade. Why is that? The answer lies in the variance of “years climbing” for the ascents logged between men and women in this dataset. If you look at the figure above, the blue contour line has a much wider span horizontally for men than it does for women, meaning that men have started climbing in a much more scattered time frame than women have. In other words, the majority of women have started climbing in the last 20 years, whereas the majority of men have been climbing for more than 40 years. This higher variability of years climbing unconditionally skews the distribution of years, increasing the average, creating this difference between men and women.