Jekyll2024-05-22T15:28:16+01:00http://www.alessandromasullo.com/feed.xmlLaumosLI'm a Sr. Data Scientist at [Veritone](https://www.veritone.com/) specialised in Computer Vision. I'm passionate about climbing, technology and music production.Alessandro MasulloThe Inverse Matrix of Protein Balls2024-05-21T01:00:00+01:002024-05-21T01:00:00+01:00http://www.alessandromasullo.com/blog/inverse-matrix-of-protein-ballsYou know when you read a recipe blog and all you need is the list of ingredients and instead you’re met with the whole story of the authors’ life? Well, this is that, on steroids.
A few months ago I tried some protein balls from a supermarket and I absolutely loved them. Looking at the list of ingredients as a habit, I noticed they were relatively simple, containing only: dates, peanuts, whey protein isolate powder, rice starch, grape juice concentrate and salt. I do have whey protein powder and some dry prunes at home, could I try to replicate these protein balls using only the ingredients that I had at my disposal? I thought it was a fun challenge, so I gave it a go.
In order to make the protein balls as similar as possible to the supermarket ones, I thought that it would make sense to try and match the nutritional table (energy, fats, carbs…) as close as possible. If my protein balls have a very similar amount of carbs, fibre, fat and so on, it is likely that at least the consistency will be very similar.
So, how do I even calculate the nutritional values of a homemade recipe? It’s actually quite easy to do. Every ingredient has a nutritional table with measurements per 100 grams. If you calculate the amount of, for example, carbs for each ingredient, you can simply sum the carbs of all ingredient to get the carbs of the final recipe. For example, if peanut butter has 50 g of fat per 100 grams and I use only 10 grams of it, I have 5 grams of fat. If I mix it with 50 grams prunes, which have only 1 gram of fat per 100 grams, that is 0.5 grams of fat. The final recipe will have 5+0.5 grams of fat in total. The same is valid for the rest of the ingredients.
These are the ingredients that I had at home, together with the nutritional values per 100 grams:
Energy
Fat
Carbs
Fibre
Protein
Salt
Protein powder
377
4
11
2.6
73
0.38
Peanut butter
643
54.3
7.4
6.7
27.7
1.1
Dry Prunes
237
0.5
52.4
6.9
2.2
0.13
And these are the nutritional values that of the protein balls that I want to match:
Energy
Fat
Carbs
Fibre
Protein
Salt
Protein balls
366
10
45.8
5.8
20.2
0.11
How do I find the right amount of protein powder, peanut butter and dry prunes, so that mixed together they have those nutritional values? Let’s get more sciency and see how to do this.
Let the nutritional values be Energy (E), Fat (F), Carbs (C), fibRe (R), Protein (P), Salt (S) and the ingredients be Protein Powder (PP), Peanut Butter (PB) and Dry Prunes (DP). The nutritional values per 100 grams for each ingredient are represented by the symbols \(E_{PP}\) (Energy of Protein Powder per 100 grams), \(F_{PB}\) (Fat of Peanut Butter per 100 grams), etc.
The final nutritional values for a recipe can be easily calculated as the sum of the contributions coming from each ingredient. For example, the total carbs C will be:
where \(w_{PP}\), \(w_{PB}\) and \(w_{DP}\) are the weights of respectively Protein Powder, Peanut Butter and Dry Prunes, while the \(C_{i}\) are the carbs per 100 grams of each ingredient.
Since the recipe that we want to find is unknown, we can call the weights of each ingredient \(x\) and we may as well divide them by 100 to simplify the equation:
\[x_i = \frac{w_i}{100},\text{ for }i\in\left\{\text{PB},\text{PP},\text{DP}\right\}\]
Our aim is to obtain a recipe that matches the nutritional values of my favourite protein balls using the ingredients at my disposal. We can therefore write a set of equations for each nutritional value that should be satisfied simultaneously:
If we call the vector of nutritional values \(V=(E,F,C,R,P,S)\) and the unknown recipe vector \(\hat{x}=(x_{PP},x_{PB},x_{DP})\), we can reshape these equations in matrix form:
\[V = M\cdot\hat{x}\]
Where \(M\) is the equation of nutritional values of each ingredient:
From linear algebra, if a system of linear equations has more equations that unknowns, it’s called an overdetermined system and it almost always has no solution. But fear not! This simply means that it’s very unlikely to find a combination of ingredients producing an exact match for all the nutritional values of our target recipe. In order for the solution to exist and be unique, the number of ingredients (unknowns) must match the number of equations (nutritional values we want to match). This means that we could either add more ingredients to the recipe, or choose a sub-set of nutritional values that we want to match (for example fat, carbs and proteins).
But what if we want a solution that is close enough? The overdetermined system may not have an exact solution, but I don’t really mind if my recipe if off by some fraction of grams…
Overdetermined systems can be solved using a method called ordinary least squares, which provides a solution that won’t be exact, but it will be the closest that is possible to achieve. Let’s see how to do this starting from the matrix form of the recipe equation:
\[V = M\cdot\hat{x}\]
If we multiply both sides of the equation for the transpose of \(M\), namely \(M^T\):
\[M^T V = M^T M\cdot\hat{x}\]
we can now multiply both sides by the inverse matrix \((M^T M)^{-1}\):
\[(M^T M)^{-1}M^T V = (M^T M)^{-1}(M^T M)\cdot\hat{x}\]
The product of a matrix and its inverse produces the identity matrix, so we can rewrite this as:
\[\hat{x} = (M^T M)^{-1}M^T V\]
Provided that the matrix \((M^T M)^{-1}M^T\) exists (which in special cases it might not), we got ourself a recipe for protein balls.
Let’s now put some numbers into the equation, see what the actual recipe is like and how far the solution is from the target recipe.
These are the ingredients that I have at home, with their nutritional values:
Energy
Fat
Carbs
Fibre
Protein
Salt
Protein powder
377
4
11
2.6
73
0.38
Peanut butter
643
54.3
7.4
6.7
27.7
1.1
Dry Prunes
237
0.5
52.4
6.9
2.2
0.13
and the nutritional values of my favourite protein balls:
Energy
Fat
Carbs
Fibre
Protein
Salt
366
10
45.8
5.8
20.2
0.11
We can put the values in the matrix \(M\) and the vector \(V\):
or in more readable form, 19.1 grams of protein powder, 16.0 grams of peanut butter and 80.8 grams of dry prunes.
But you may be wondering, how close are the nutritional values of this recipe compared to the target one? To calculate the error, all we have to do is to replace the solution in the system of equations (i.e. calculate the nutritional values for this recipe) and see how far off we are from the target. If we do that, we obtain:
Energy
Fat
Carbs
Fibre
Protein
Salt
Target recipe
366
10
45.8
5.8
20.2
0.11
Estimated recipe
366
9.8
45.6
7.1
20.2
0.35
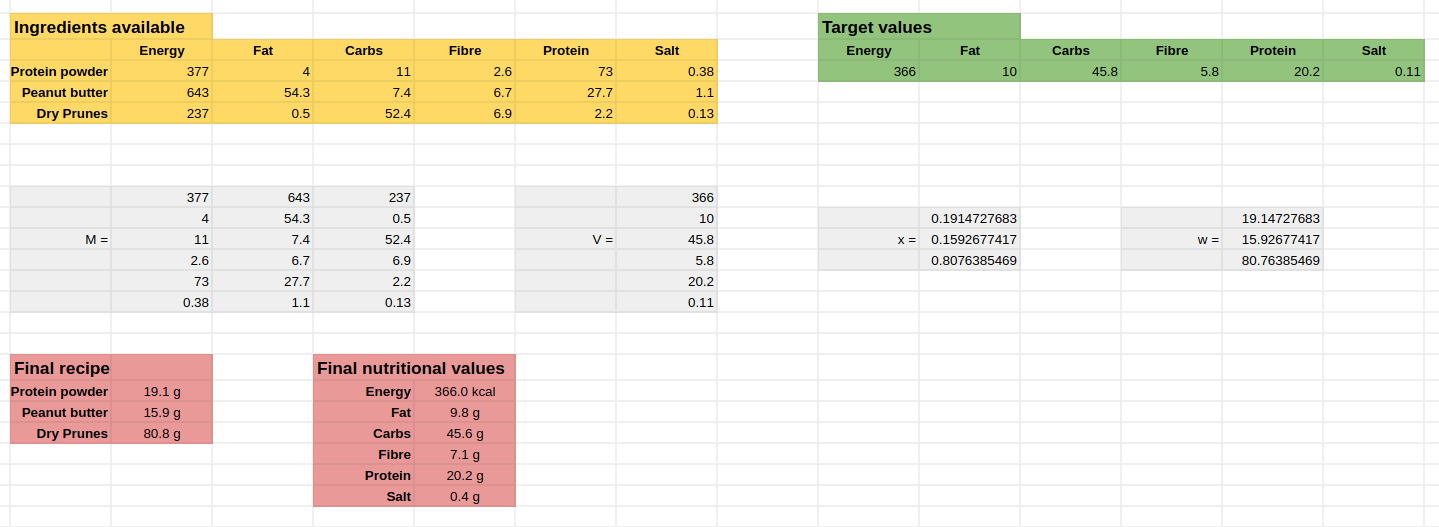
Pretty good, right? If you want to have a play with these formulas and calculate your recipe based on your ingredients, I also made a spreadsheet that you can download from here:
Simply change the orange table with the nutritional values of your ingredients and see the final recipe in the red cells.
The actual recipe
At last, here is the final recipe. The list of ingredients from the previous calculation is:
Dry prunes: 80.8 grams
Peanut butter: 16.0 grams
Protein powder: 19.1 grams
Procedure: Mix the ingredients in a bowl and start kneading them with your hands until they become like a dough. The prunes should break completely and the final consistency should be similar to shortbread/tart dough, but sticky.
Shape with your hands into balls of 10-15 grams each and keep overnight in the fridge (or a few hours in the freezer). You can eat them straight away but the consistency will be much better after chilling. You can store in the fridge for some time, I think I stored them up to 10 days and they were still perfect, but don’t quote me on that.
Note: For the protein powder I used pure whey powder (flavoured), which also has sweetener, thickener and emulsifier in its ingredients. Using different flavours is a really good way to mix it up.
There you have it. Protein balls made with inverse matrices.
]]>Alessandro MasulloAnalysis of 4 million climbing ascents2022-08-24T01:00:00+01:002022-08-24T01:00:00+01:00http://www.alessandromasullo.com/blog/analysis-of-4-million-climbing-ascentsThis article was updated on the 06/09/2022. Changes can be seen here.
A series on videos inspired by this article is also available on YouTube.
TL;DR
Here are the main findings from this article.
For climbers who achieve these grades, it takes on average:
4-5 years to climb their first 7a
8-9 years to climb their first 8a
12-13 years to climb their first 9a
If the average climber can flash up to:
6c, they can probably redpoint 7a
7b/+, they can probably redpoint 8a
8b, they can probably redpoint 9a
Using a mathematical model, we can predict it’ll take 19-20 uninterrupted years, since when one started climbing, to send a 10a and 22 years to send a 10b.
Adam Ondra climbed Silence (9c) 18 years after he started climbing.
The average boulderer will climb their first 7A (Font) around the same time as the average sport climber with their first 7a (sport) route.
No, you haven’t plateaued. Your improvement is probably less than a “+” grade and you just can’t notice it.
If any of these triggered your attention, please read the rest of this article for more.
Introduction
I recently found a dataset on Kaggle that sparked my attention, 8a.nu
Climbing
Logbook. Since I love data, and I love climbing, this was the perfect opportunity to answer some of the questions that are often asked in climbing. I broke down the article into sections, you can jump to a specific question using the following links:
The dataset includes 62,593 users (53,902 men and 8,691 women) who
logged a total of 4,111,877 ascents (that’s more than 4 millions!),
including sport climbing (n=2,875,675) and bouldering (n=1,236,202). The
average number of ascents per user is 110, with the majority of the
users (median) logging 35 ascents and 90% of them logging between 3 and
306 ascents. One single user, in total, logged 1,987 ascents; we don’t
know much about him, but he’s climbed two 8bs and an 8b+.
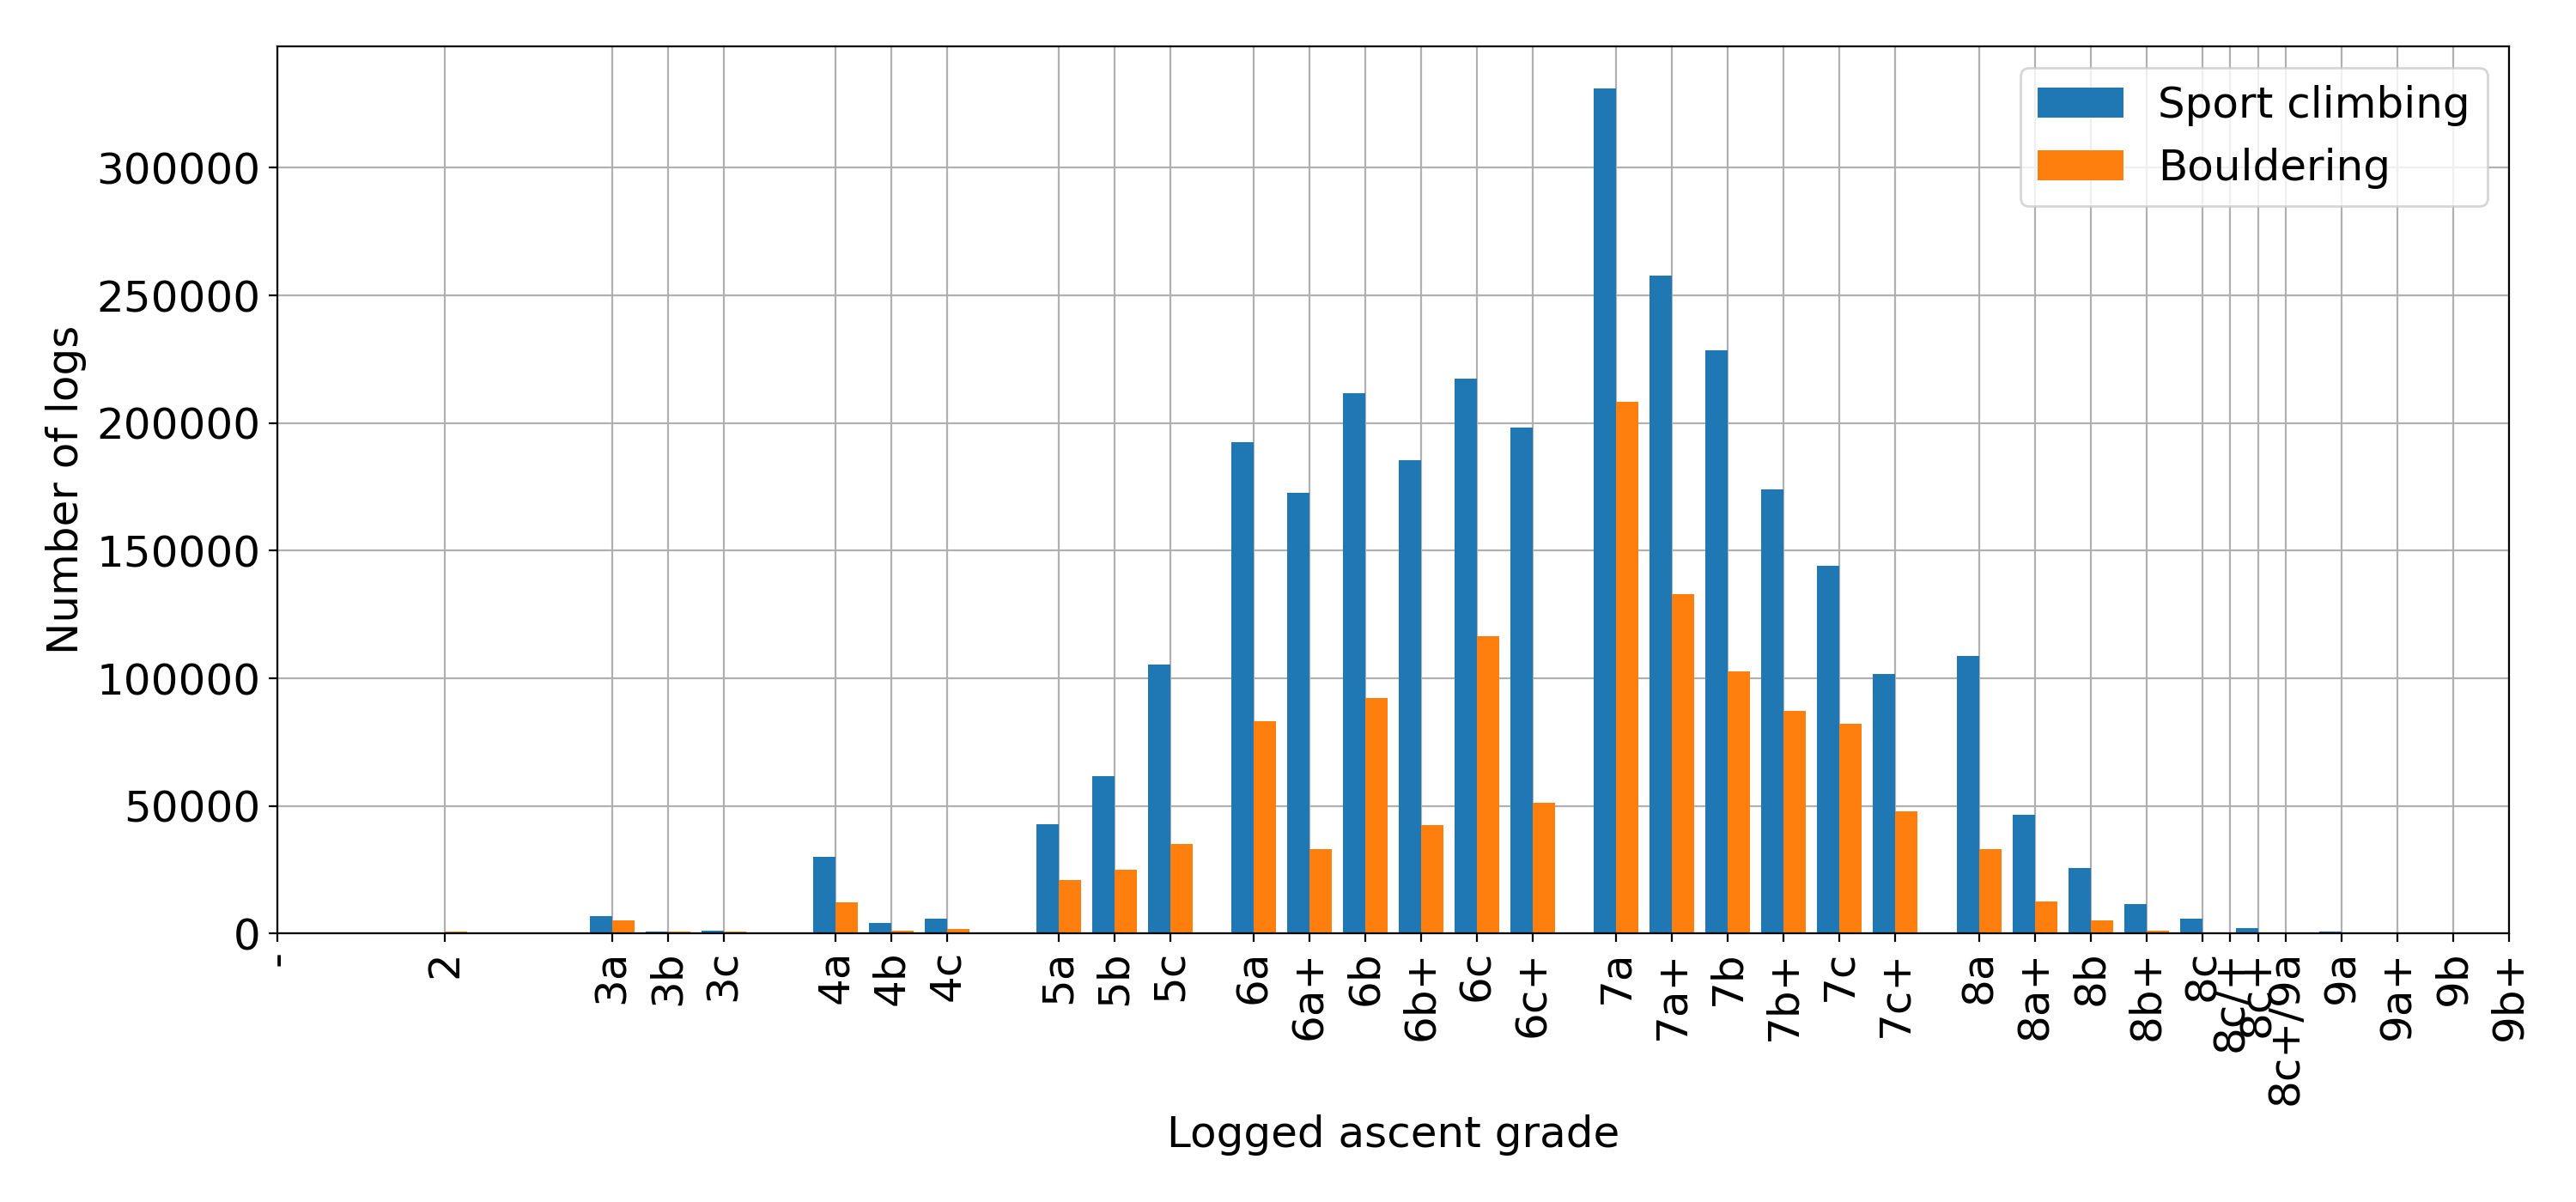
“The most logged grade is 7a for sport and 7A for bouldering”
If we look at the histogram of grades for all the ascents, the most
logged grade is 7a for sport and 7A for bouldering. It’s funny to see how
“+” grades are climbed (or logged) less than “whole” grades, especially
for bouldering. Grades 6A, 6B and 6C have around 100k boulder
ascents, while 6A+, 6B+ and 6C+ have less than half. After 7a/7A, every
little progress counts and all the grades have a more regular
distribution.
“Grades 6A+, 6B+ and 6C+ have less than half the logs for 6A, 6B and 6C”
Figure 1 Histogram of grades of all logged ascents
For sport climbing, the “+” vs “whole” grade is less noticeable, but
it’s still interesting to see how the number of logged 8a is higher
than 7c+, breaking an otherwise continuously decreasing distribution. To
be fair, if you’re strong enough to climb a 7c+, why not jump
straight on an 8a?
Max flash vs Max redpoint
In this section I’m going to answer the questions: “what grade can you expect to climb given your maximum flash?” and “what grade
can you expect to flash, given your maximum redpoint?”. For those unfamiliar with climbing terms, to “flash” a route means climbing it on the first attempt, without falls or rests on the rope, using no other holds than the rock itself. To “redpoint” means climbing a route in the same conditions but after having practiced the moves (after any number of attempts).
To answer these questions, I grouped ascents by user and selected their
maximum redpoint and flash/on-sight (OS) grades. I then averaged the
results and plotted them against each other. Although the dataset
discriminates between flash and OS, I decided to group them
together because there were not enough datapoints for each category. The
results are shown below.
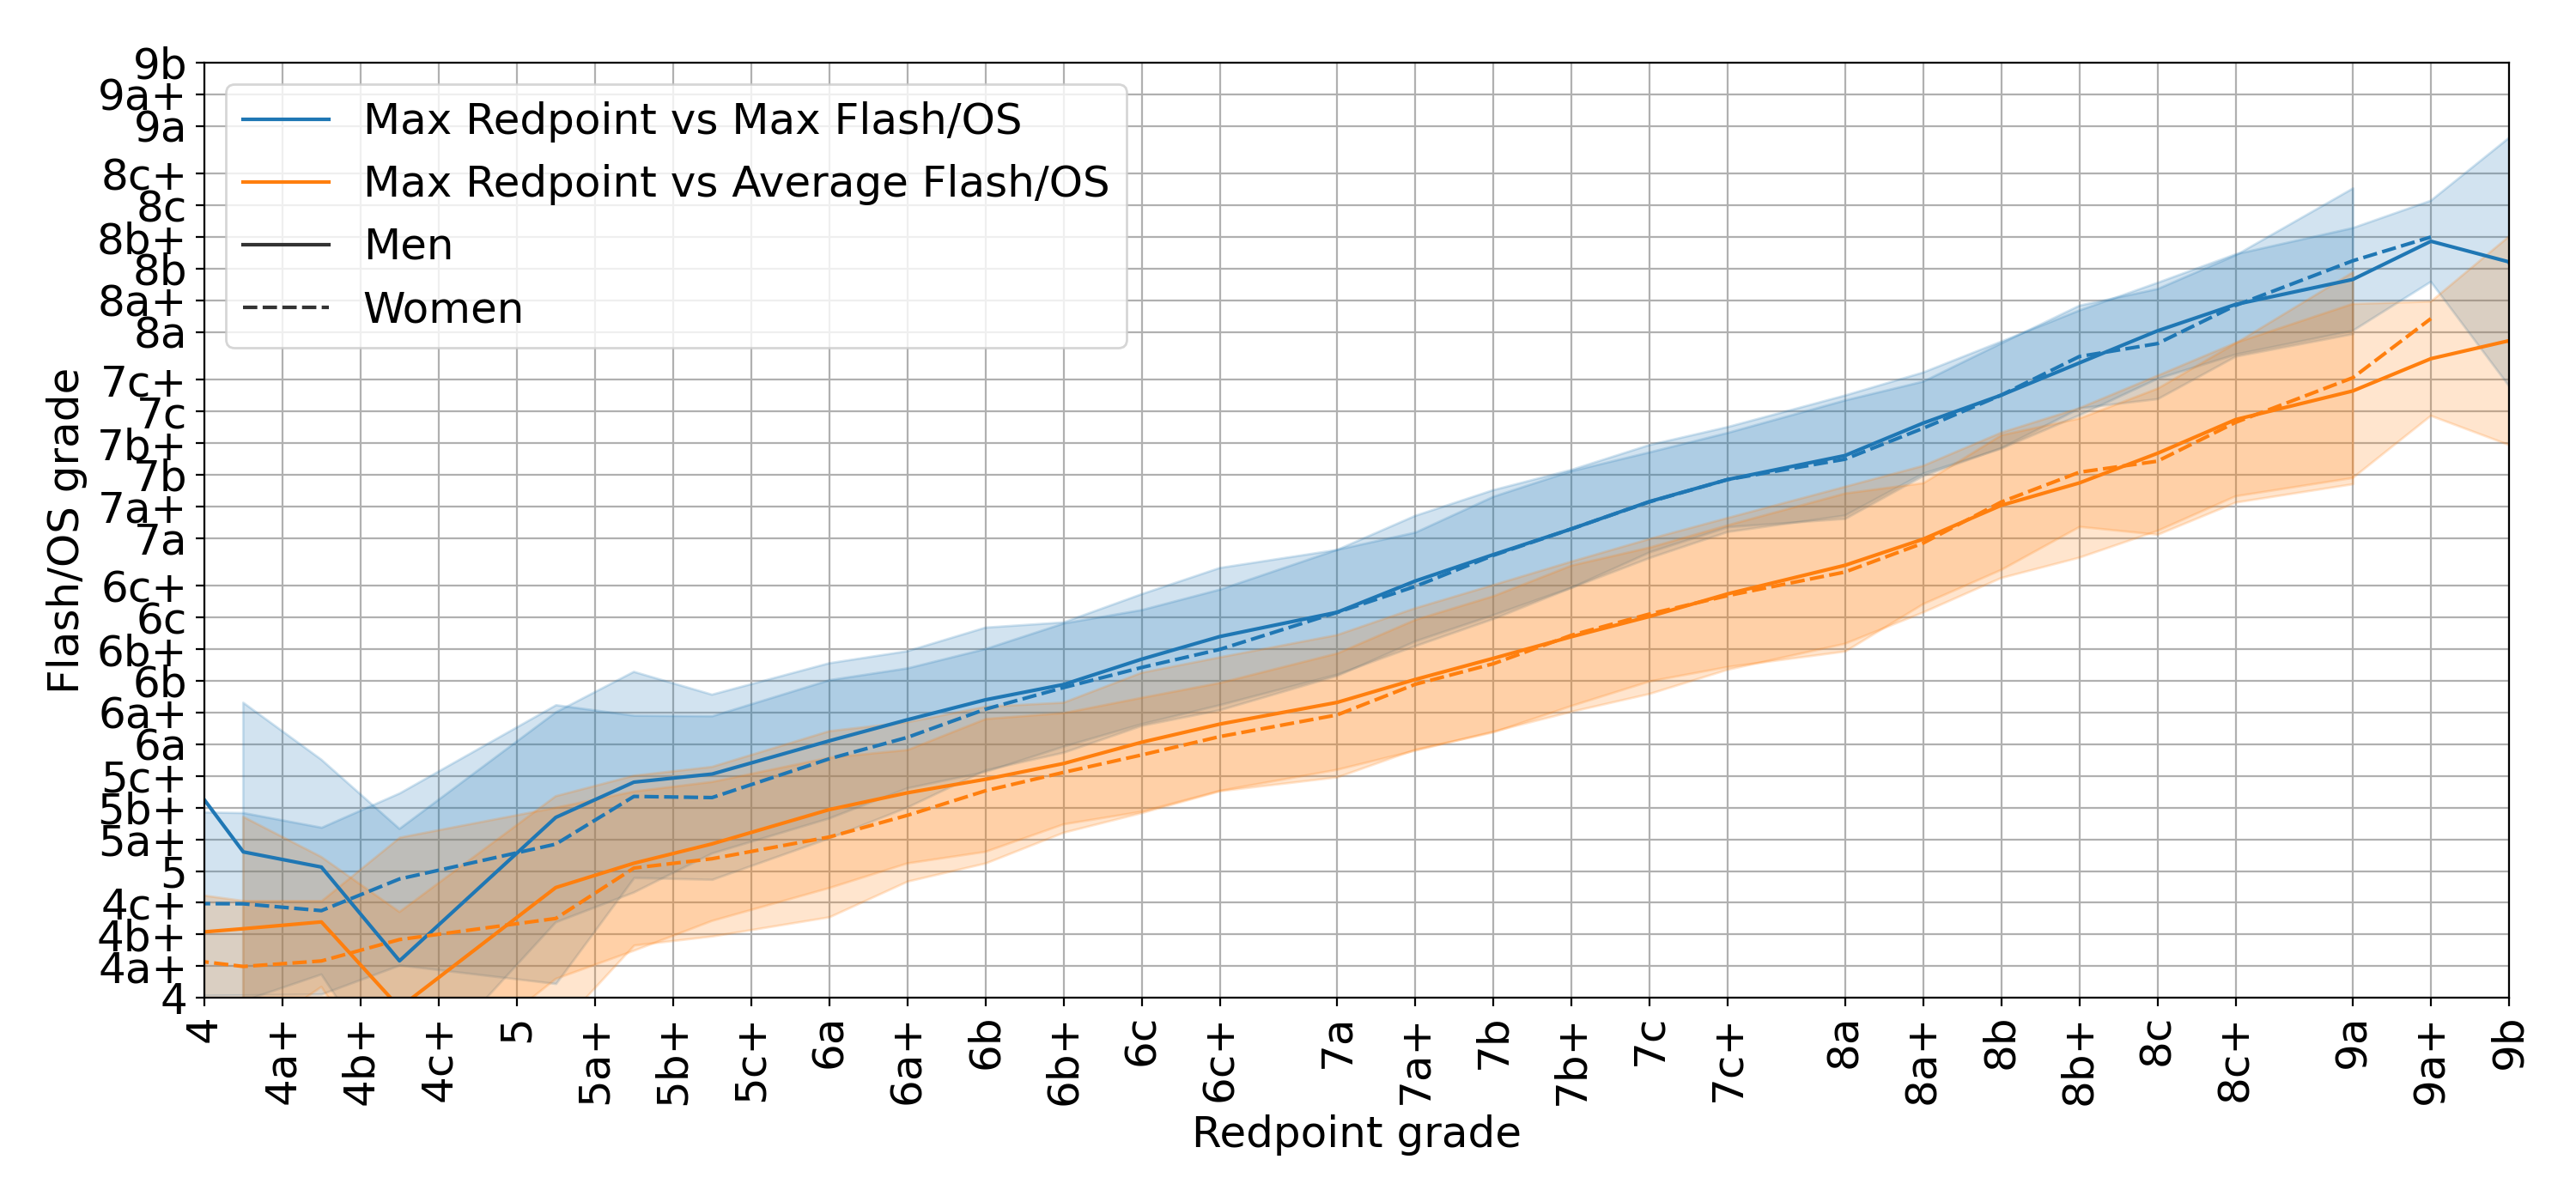
Figure 2 Relationship between Flash/OS grade and Max redpoint grade for men and women
The plot shows a solid line (dashed for women) to represent the mean,
and a transparent area to represent the standard deviation. If you’re
not familiar with the concept of standard
deviation, consider
that this plot applies within the transparent area to around
70%
of all users. If you make it 3 times wider, the area will apply to 99%
of the population.
The plot is very interesting and it can be read both by entering with a
redpoint grade from the x-axis (horizontal) to read a flash/OS grade, or
from the y-axis (vertical) with a flash/OS grade to read a redpoint
grade. To take myself as an example, let’s start with the blue curve: my
maximum redpoint is 7b, which according to the plot means that I should
be able to flash 7a. My maximum Flash/OS grade is actually 7a+, which
produces a 7b+/7c maximum redpoint. I have tried a few 7b+ and I’m
definitely close to sending them, so the results seem to be valid for
me. If we follow the orange curve, with a maximum redpoint of 7b, it
says that I should be able to flash/OS, on average, 6b/6b+, which is
probably the grade I feel the most confident I can flash/OS.
“To climb your first 7a, you need to be able to flash up to 6c and consistently flash 6a+/6b.”
“To climb your first 8a, you need to be able to flash up to 7b/+ and consistently flash 6c+/7a.”
“To climb your first 9a, you need to be able to flash up to 8b and consistently flash 7b/+.”
In appendix A1 you can find a table version of this plot to make it
easier to read.
You can notice that for low grades, like max redpoint of 5a+, the expected maximum flash/OS grade is 5b+, which is higher than the redpoint grade. How can you flash up to 5b+ if your maximum redpoint is 5a+? The reason for this inconsistency is that data after 9a and below 5 becomes very fuzzy because the number of
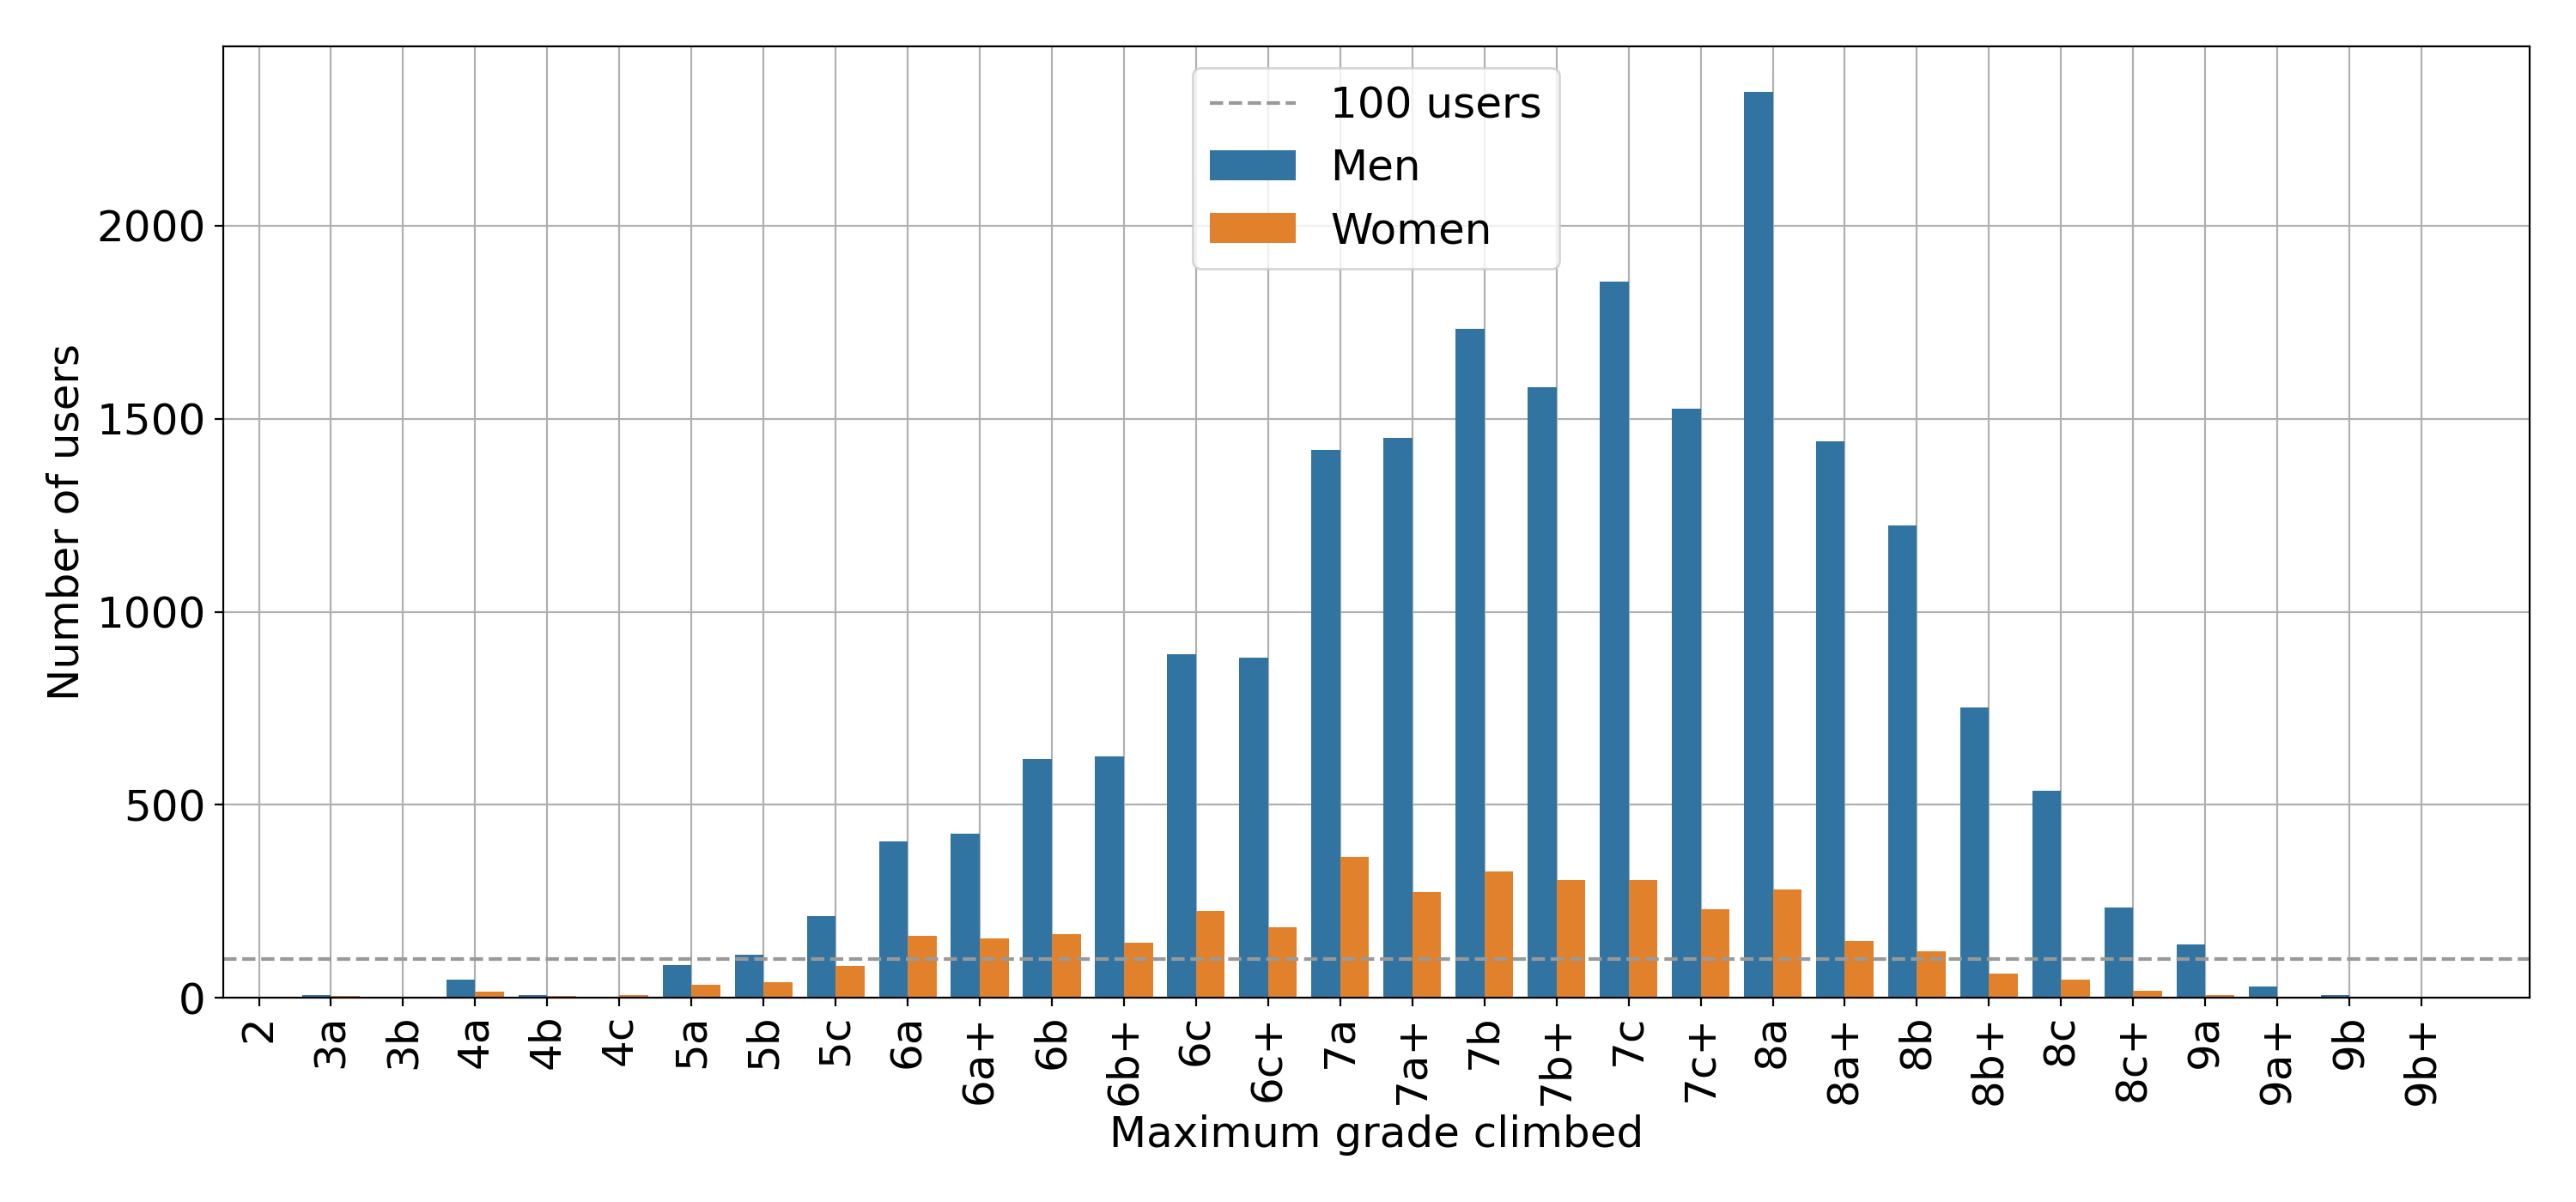
datapoints is very low. If we plot the histogram of users for the maximum grade they climbed:
Figure 3 Histogram of maximum grades for men and women
the plot shows that below grade 5b (6a for women) and above 9a (8b for
women) the number of users is less than 100 and any estimation is very unreliable.
Progression in time of grades
The next question that I want to answer is: “how many years does it take
to climb a certain grade?” I have seen a few articles online trying to
answer this question, and some of them used the same dataset as this
article. As a challenge, I preferred not reading them and trying my own
thing. To answer this question, I thought of two different approaches,
let’s call them historical progression and max grade per user. Since
the first approach didn’t seem to work properly, I’ll leave it in the
appendix (A2) and describe here the method that worked.
Max grade per user
The easiest way to calculate the progression of grades in time is to
look at the maximum grade that each user has ever climbed. The date the
user climbed this route, minus the date they started climbing, allows to
calculate the number of years required for this user to climb that
grade:
years_required = max_grade.year - user.started
Each user in the dataset therefore becomes a pair of (max_grade,
years_required) which we can plot.
Unfortunately, almost half of the users (n=25,121) had to be excluded
from this analysis because they didn’t set up the date they started
climbing in their profile. Some other users simply had impossible
numbers as dates, so I restricted the analysis to all the users who
started climbing between 1960 and 2017 (the year the dataset was
collected). A histogram of the years people started climbing is shown
below:
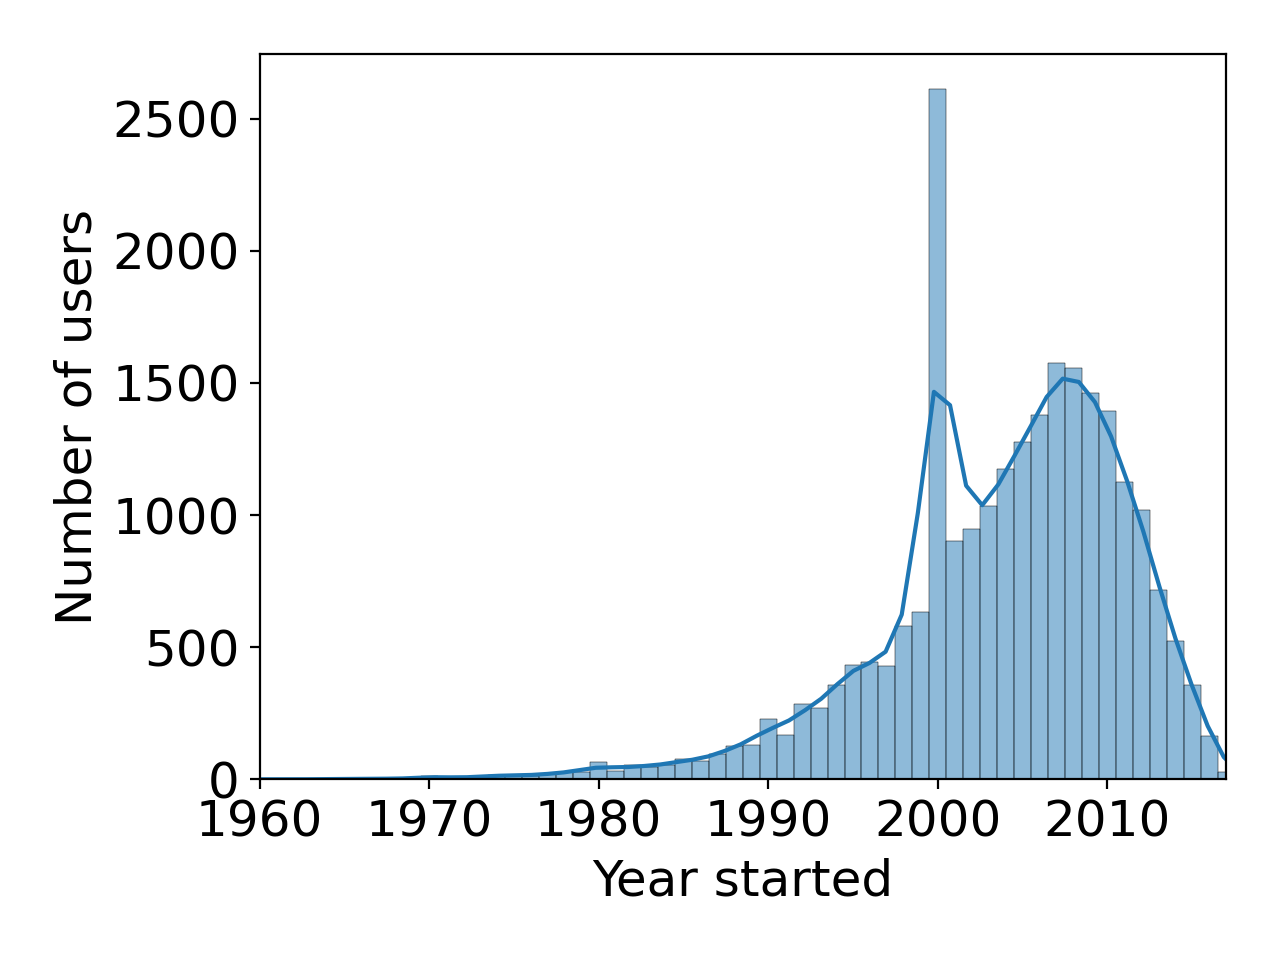
Figure 4 Histogram of year when users started climbing
For some very weird reason, the year 2000 has almost 5 times the number
of people who started climbing the year before and after. This is
clearly an irregularity in the data. Maybe 2000 was the default choice
on the website when the user first registered? Or maybe the part of the
dataset was populated with some script that had 2000 as the default year?
Anyway, I decided to exclude climbers who started climbing in 2000
because I didn’t trust their data, and ended up with a total of 29,739
users to play with.
Years required to climb a grade
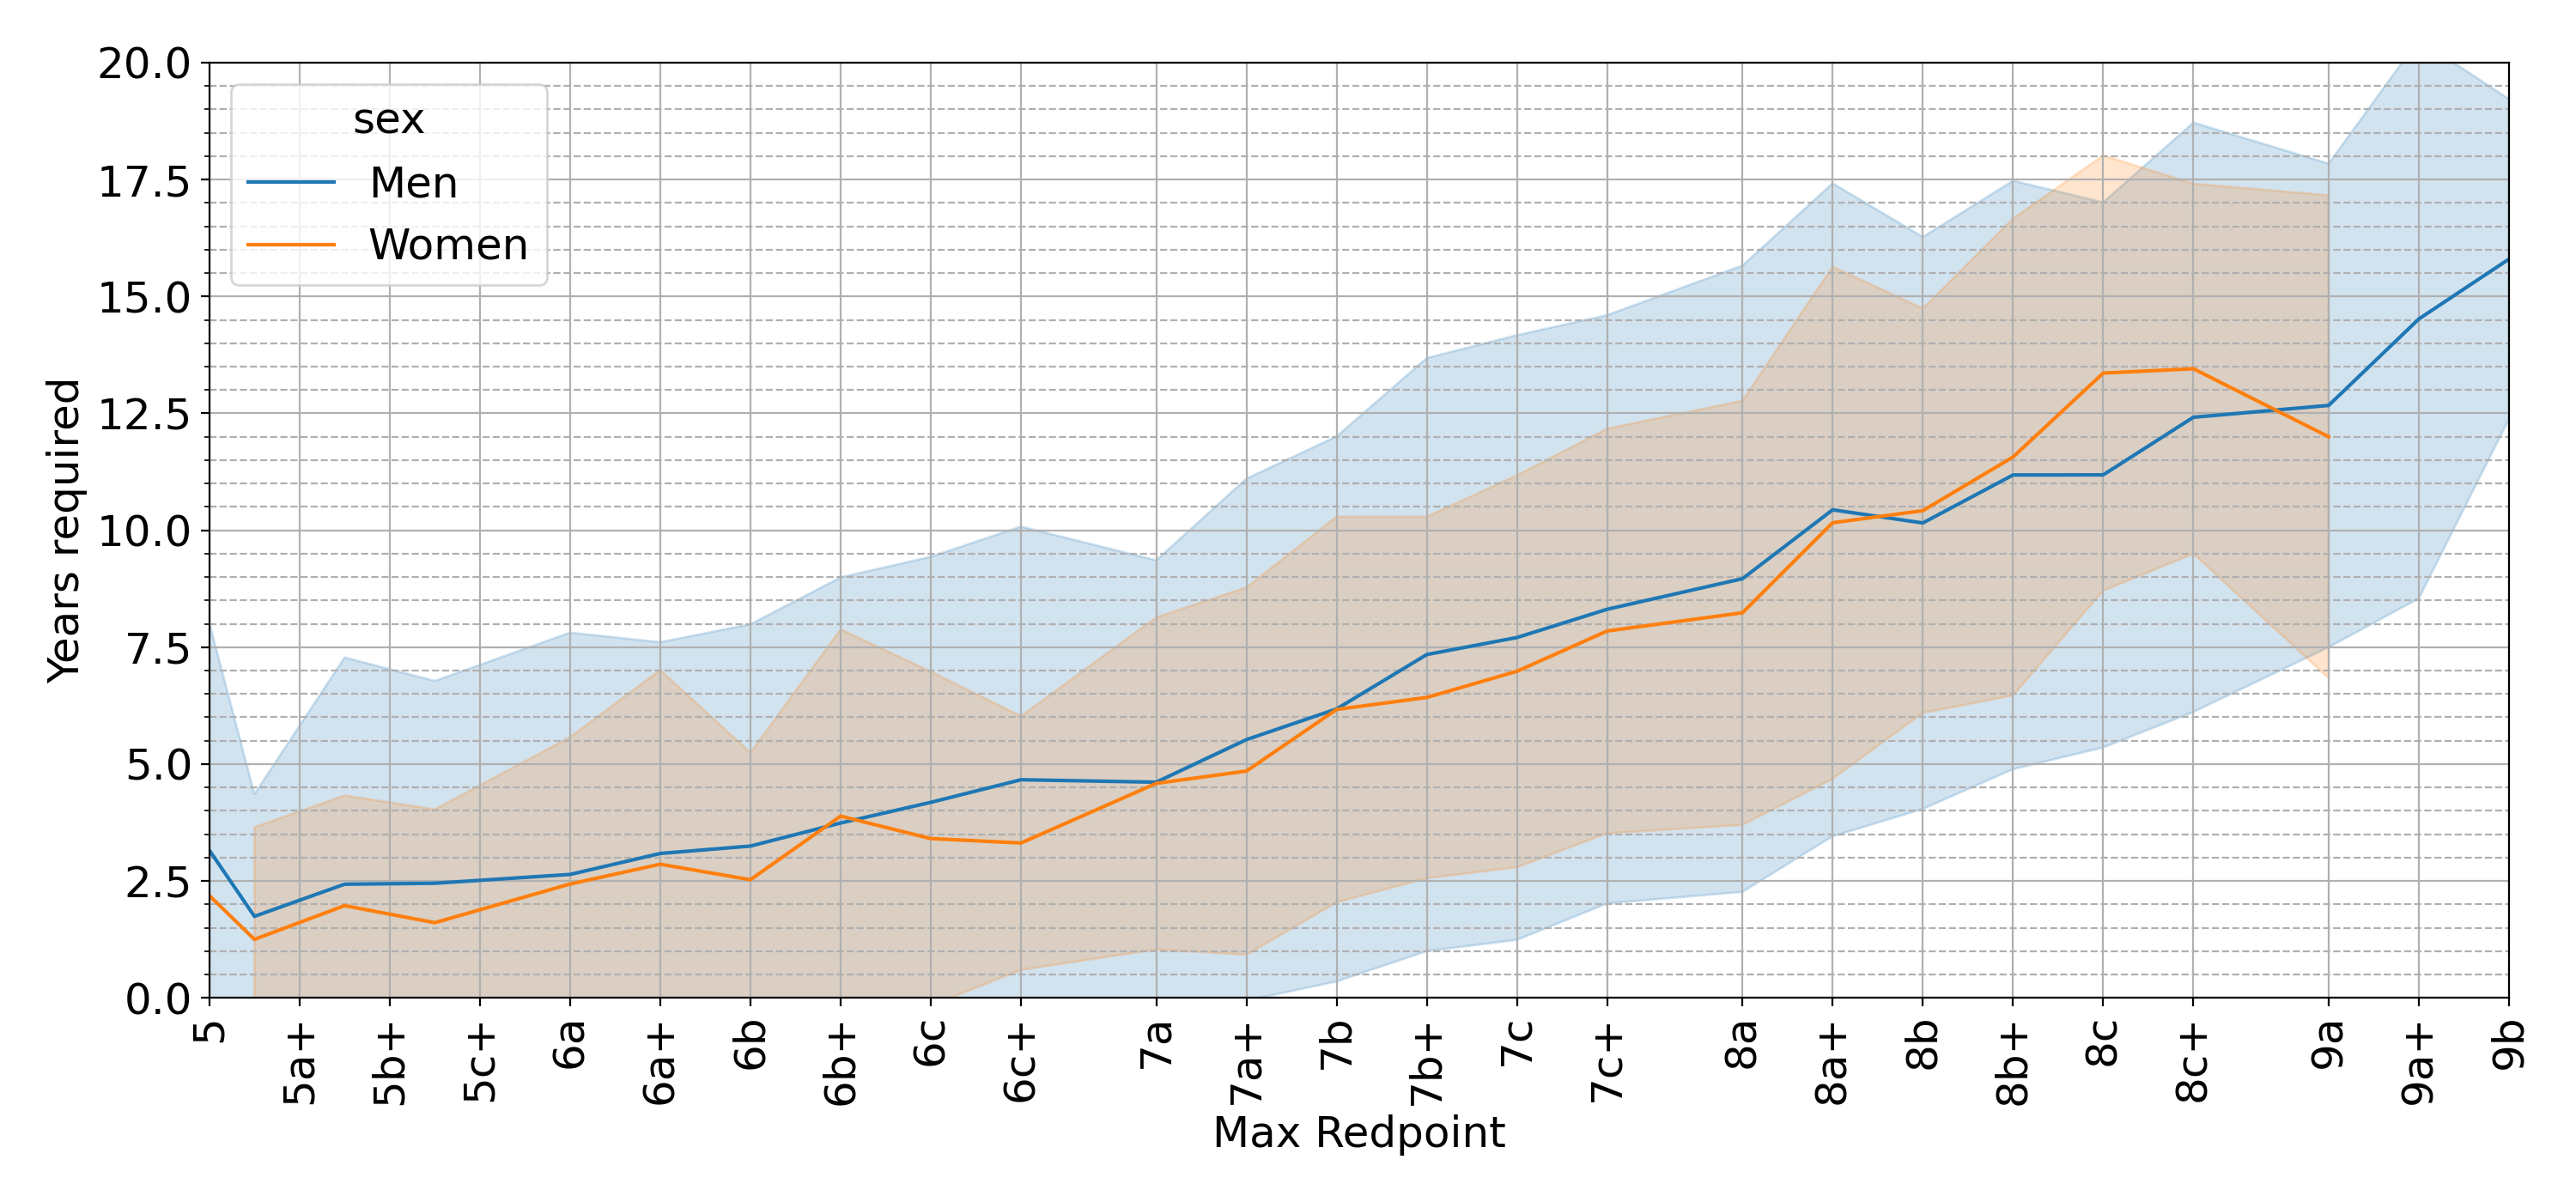
The plot in Figure 5 shows the average number of years required to redpoint a
certain grade for the first time, for men and women, in sport climbing.
This plot was created by first aggregating users by the maximum grade
they’ve ever climbed and then averaging across the number of years
it took them to send that grade. This means that what we read on the
vertical axis is an average of years across users.
Figure 5 Average number of years required to ascend a specific grade on redpoint
This plot can be read by entering the redpoint from the horizontal axis
and reading the number of years required on the vertical axis. From the
plot, it takes on average 4.5 years to climb 7a, 6 years to climb 7b,
8-9 years to climb 8a and 12 years to climb 9a. Again, to validate it on
myself, I started bouldering in 2016, started sport climbing in 2020 and I sent
my first sport 7a in 2021, which is around 5 years after I started. I
only sent my first sport 7b this year (2022), which is exactly 6 years
after I started climbing, as predicted by the data. I guess that makes me the average climber.
“It takes on average 4.5 years to climb 7a, 6 years to climb 7b,
8-9 years to climb 8a and 12 years to climb 9a.”
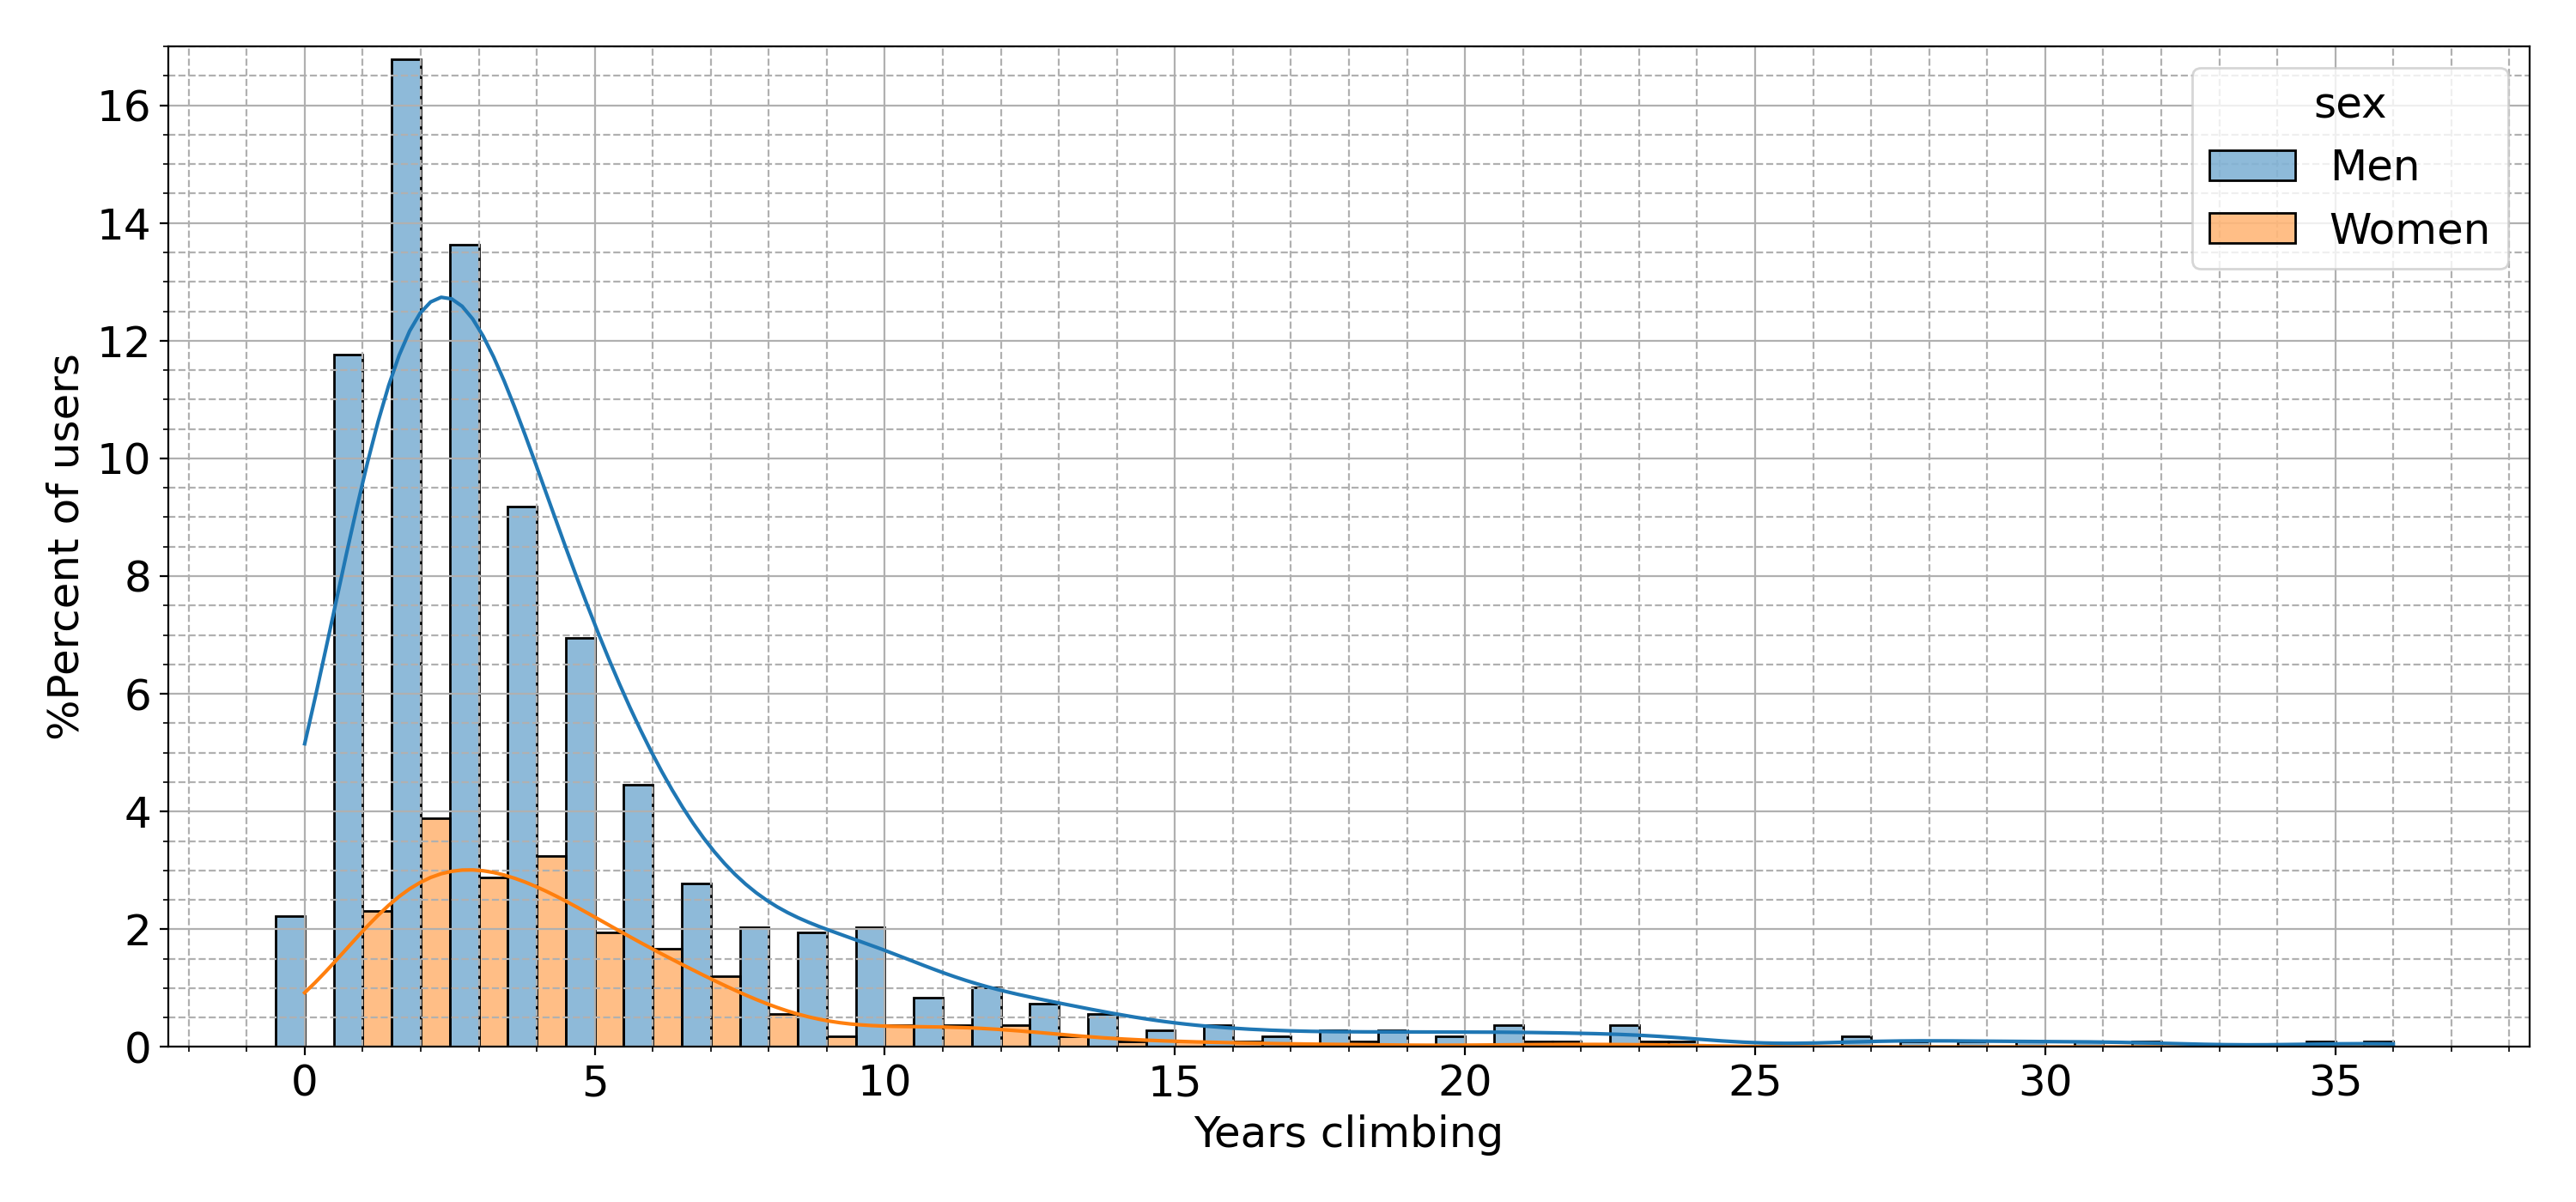
Although the plot from Figure 5 seems to depict a very simple picture (it takes y years to climb x grade), the story is more complicated than that. In fact, if we look at all the people that have climbed 7a as a maximum grade, and we look at how long it took them to send this grade, we get a very complex picture:
Figure 5b Histogram of years required to climb a 7a
From the figure, you can see that while the majority of the climbers does, indeed, take 4-5 years to climb their first 7a, the data shows that it takes anywhere between 0 and 35 years to tick this grade! The plot also shows a higher variability in “years climbing” for men than for women, which skews the men’s average slightly upwards.
Predicting the future
The number of datapoints after 9b is too little to draw any meaningful
information after that grade, however, math can help us to make an
educated guess of what happens. The number of years seems to have a
non-linear relationship with the grade. To me, the relationship seems
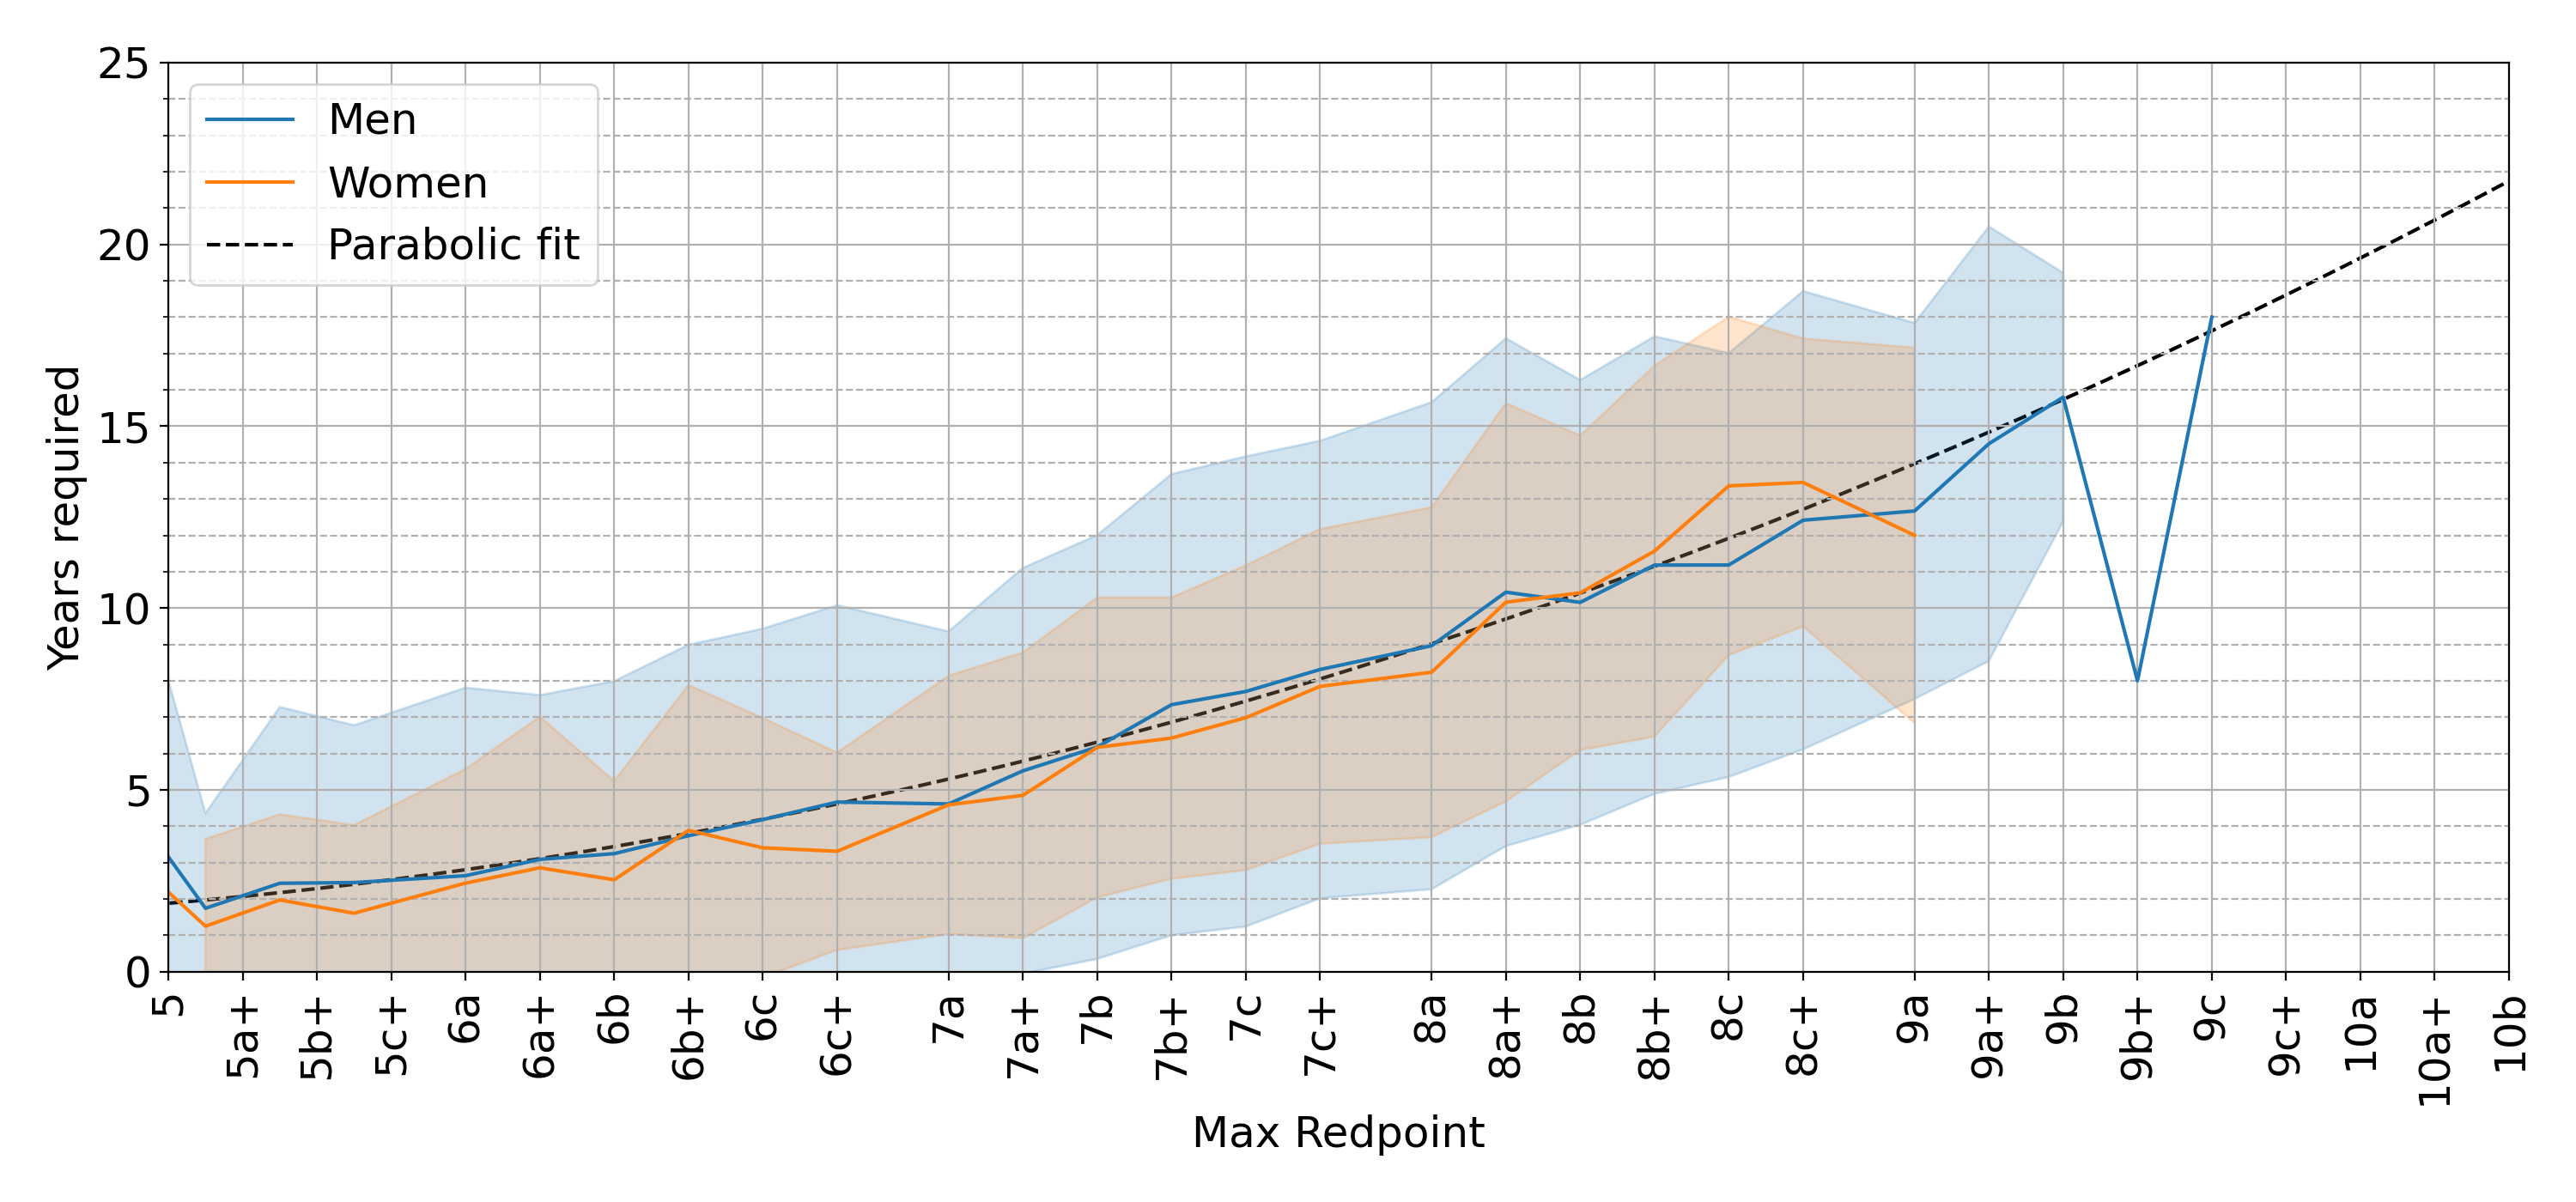
pretty much parabolic. If we fit a parabolic function through all the data,
this is what happens:
Figure 6 Parabolic fit of data from Figure 5
The parabola seems to fit the data pretty well. If my math is right, it
should require around 20 years to climb the first 10a and more than 22
years to climb a 10b. Adam Ondra, the only datapoint for 9c in this
dataset, climbed
Silence (9c) in 2017,
which is 18 years after he started climbing, just as predicted by this
model. Maybe, if he didn’t focus on the Olympics and kept climbing
outdoors, he might have already climbed the first 10a!
“If my math is right, it should require around 20 years to climb the first 10a and more than 22 years to climb a 10b.”
It’s important to note that while this model can be used to extrapolate data indefinitely, it doesn’t mean that it makes any real sense. The majority of the data used to fit the parabola is between grades 5 and 9a, with only a few datapoints available beyond 9a. Moreover, the only climbers who can achieve grades higher than 9a are professional athletes, who probably started climbing when they were really young. Having started climbing in my 20s, I would not expect to climb a 9a in my late 30s! On top of that, when we reach grades beyond 9c, we might be getting close to the limits of the human body. Extrapolation is cool but always a dangerous ground, so take these results with a pinch of salt :D
“If you started climbing in your 30s, don’t expect to climb a 10a in your 50s!”
Bouldering vs sport climbing
The results so far only considered sport climbing, but what about
bouldering? Let’s try to answer this question: “Is it easier to climb a
7a sport route or a 7A (V6) boulder?”. By using a similar approach to the
last section, we can produce a plot distinguishing between sport climbing and bouldering:
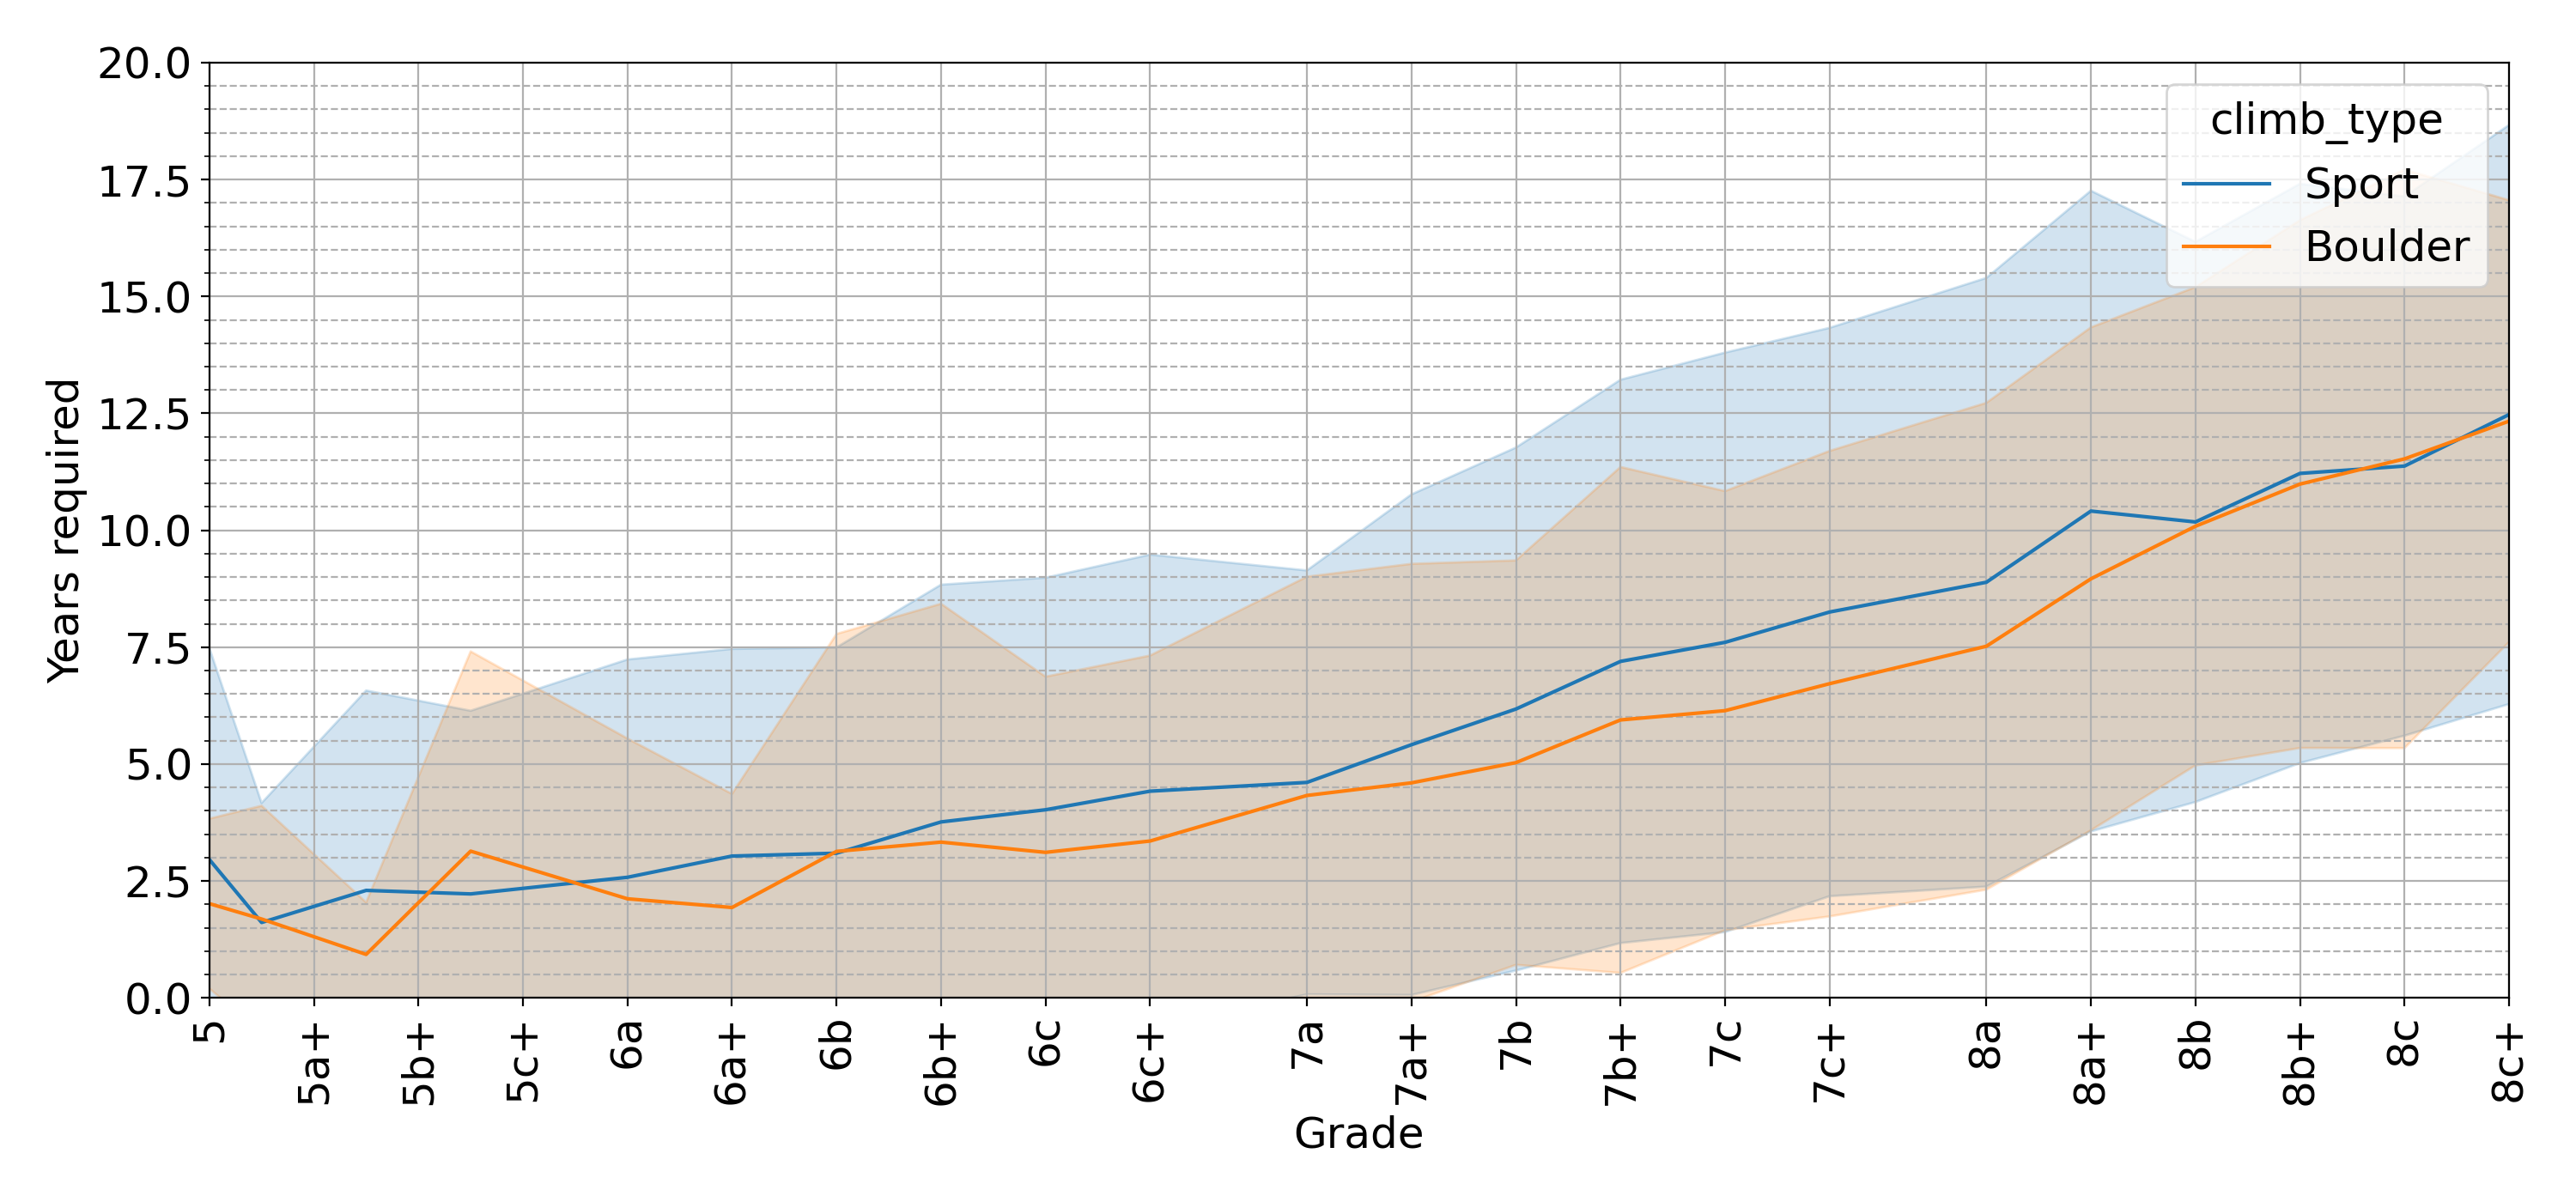
Figure 7 Average number of years required to climb a specific grade for bouldering and sport climbing
The lines are very noisy but there’s a hint that the bouldering one,
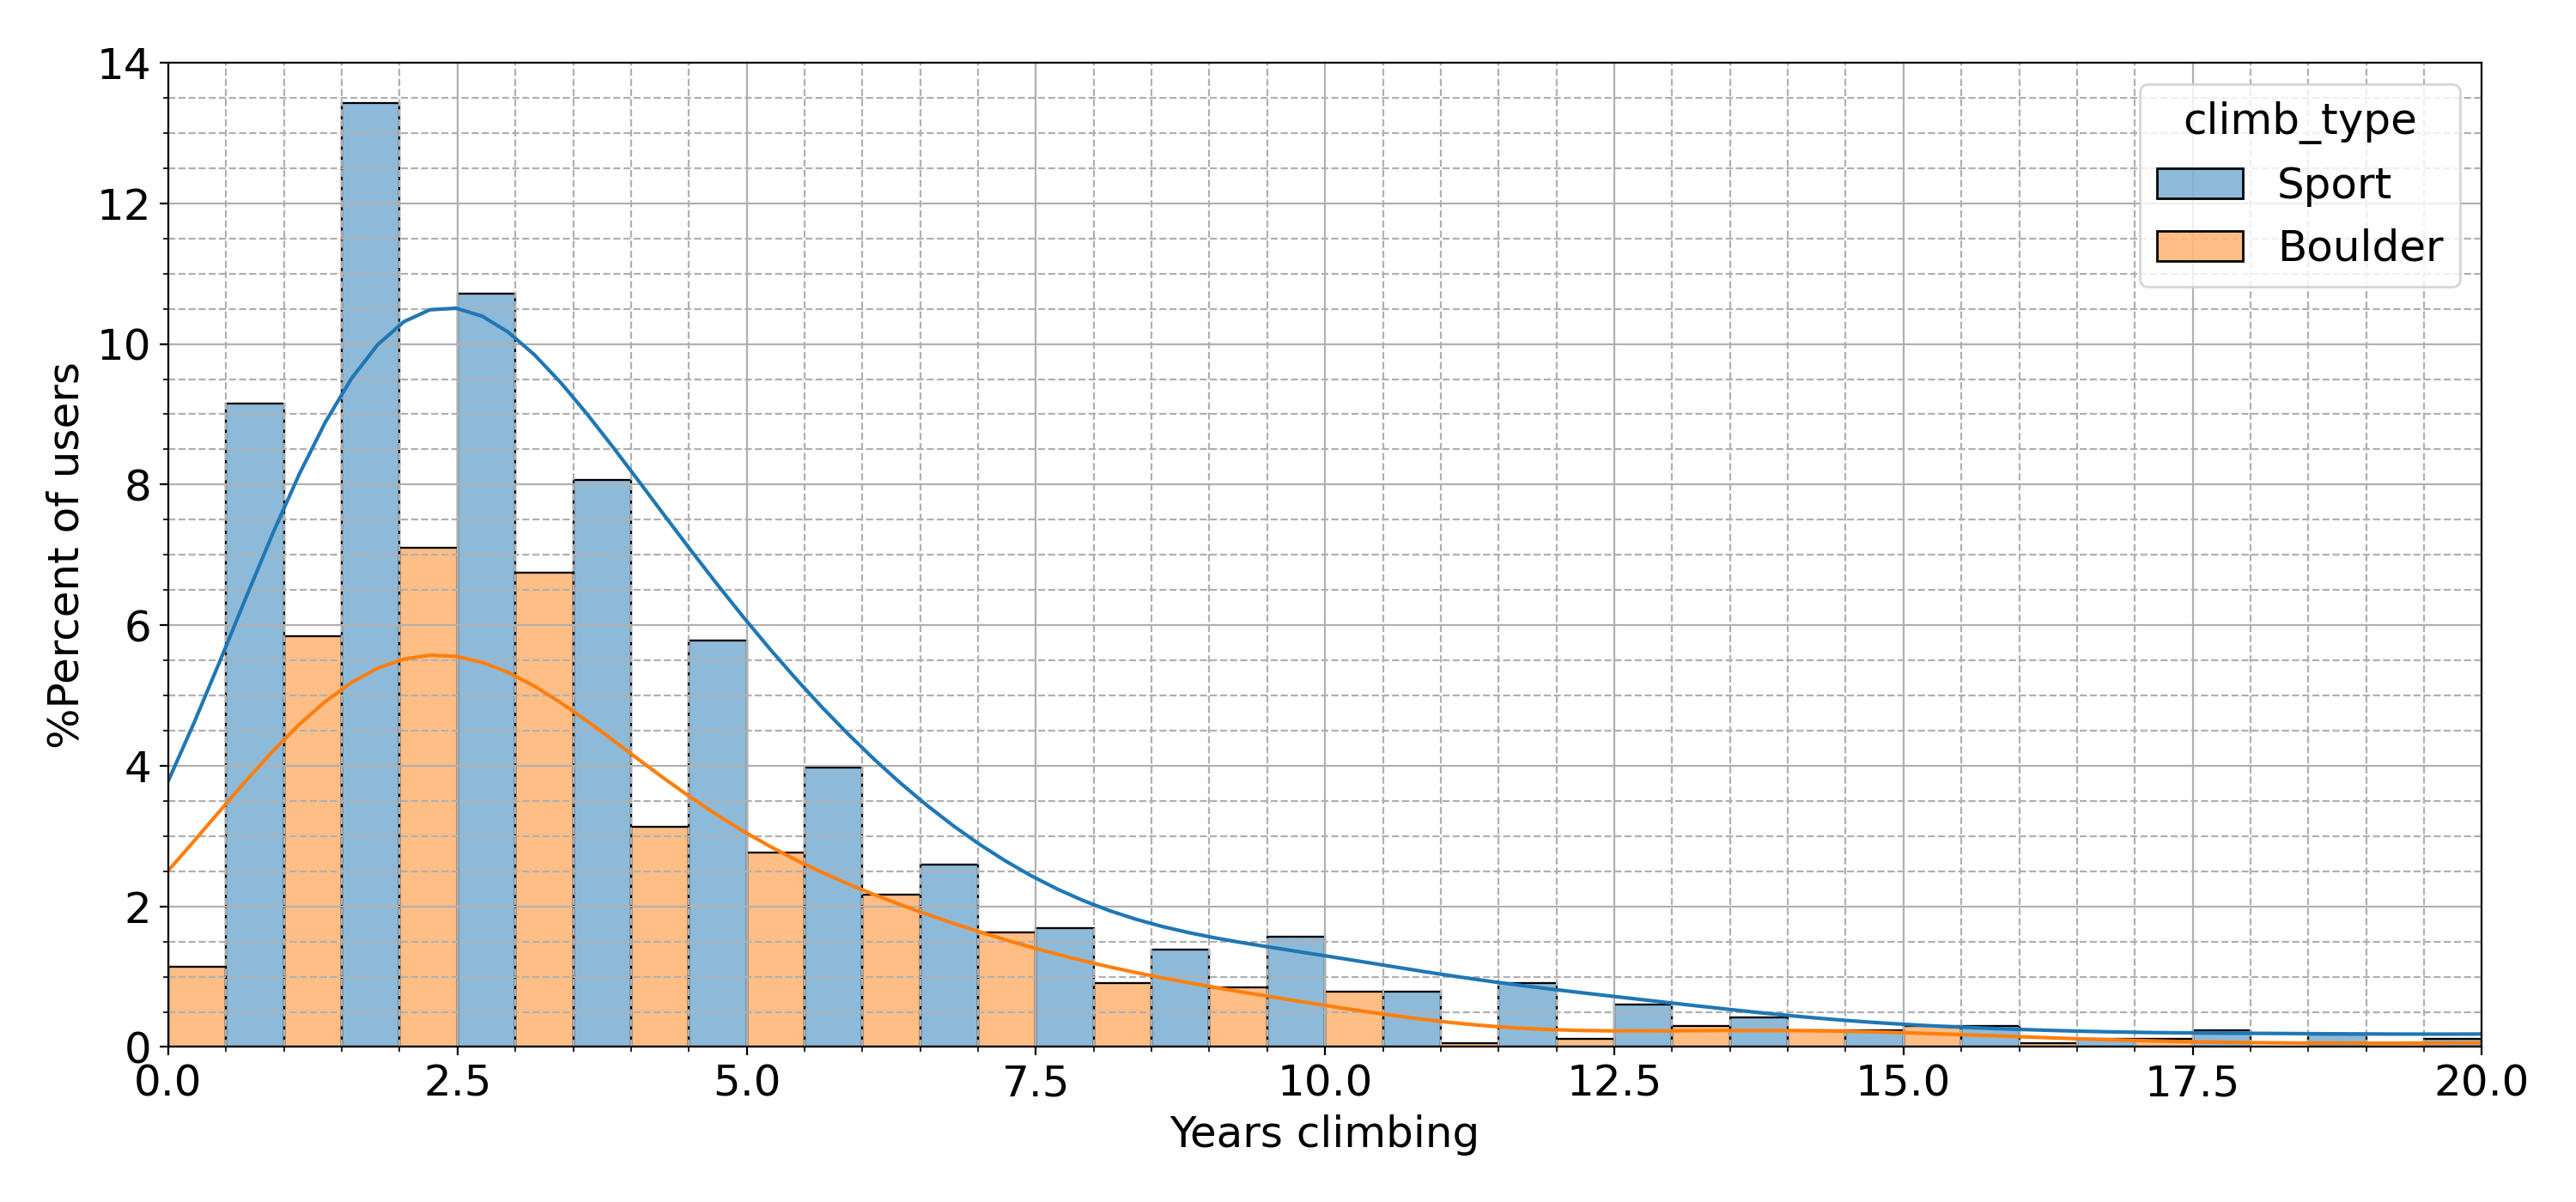
between 6B and 8B, is below the sport line. What does this mean? Let’s investigate further and look at the histogram of number of years required to climb 7a for both sport climbing and bouldering:
Figure 7b Histogram of years required to climb a 7a
The figure shows a very complex picture and it’s very difficult to tell, graphically, if it’s easier to climb a 7a route or a 7A boulder. This is why statistical tests exist, they help us to quantify results using data. Without going too much into detail, I ran a t-test on the number of years required to climb a 7a sport and the number of years required to climb a 7A boulder. The result (t=1.172, p=0.241) shows that there is no statistically significant difference between the two distributions.
“It takes the same time for a boulderer to climb their first 7A as a sport climber to climb their first 7a route.”
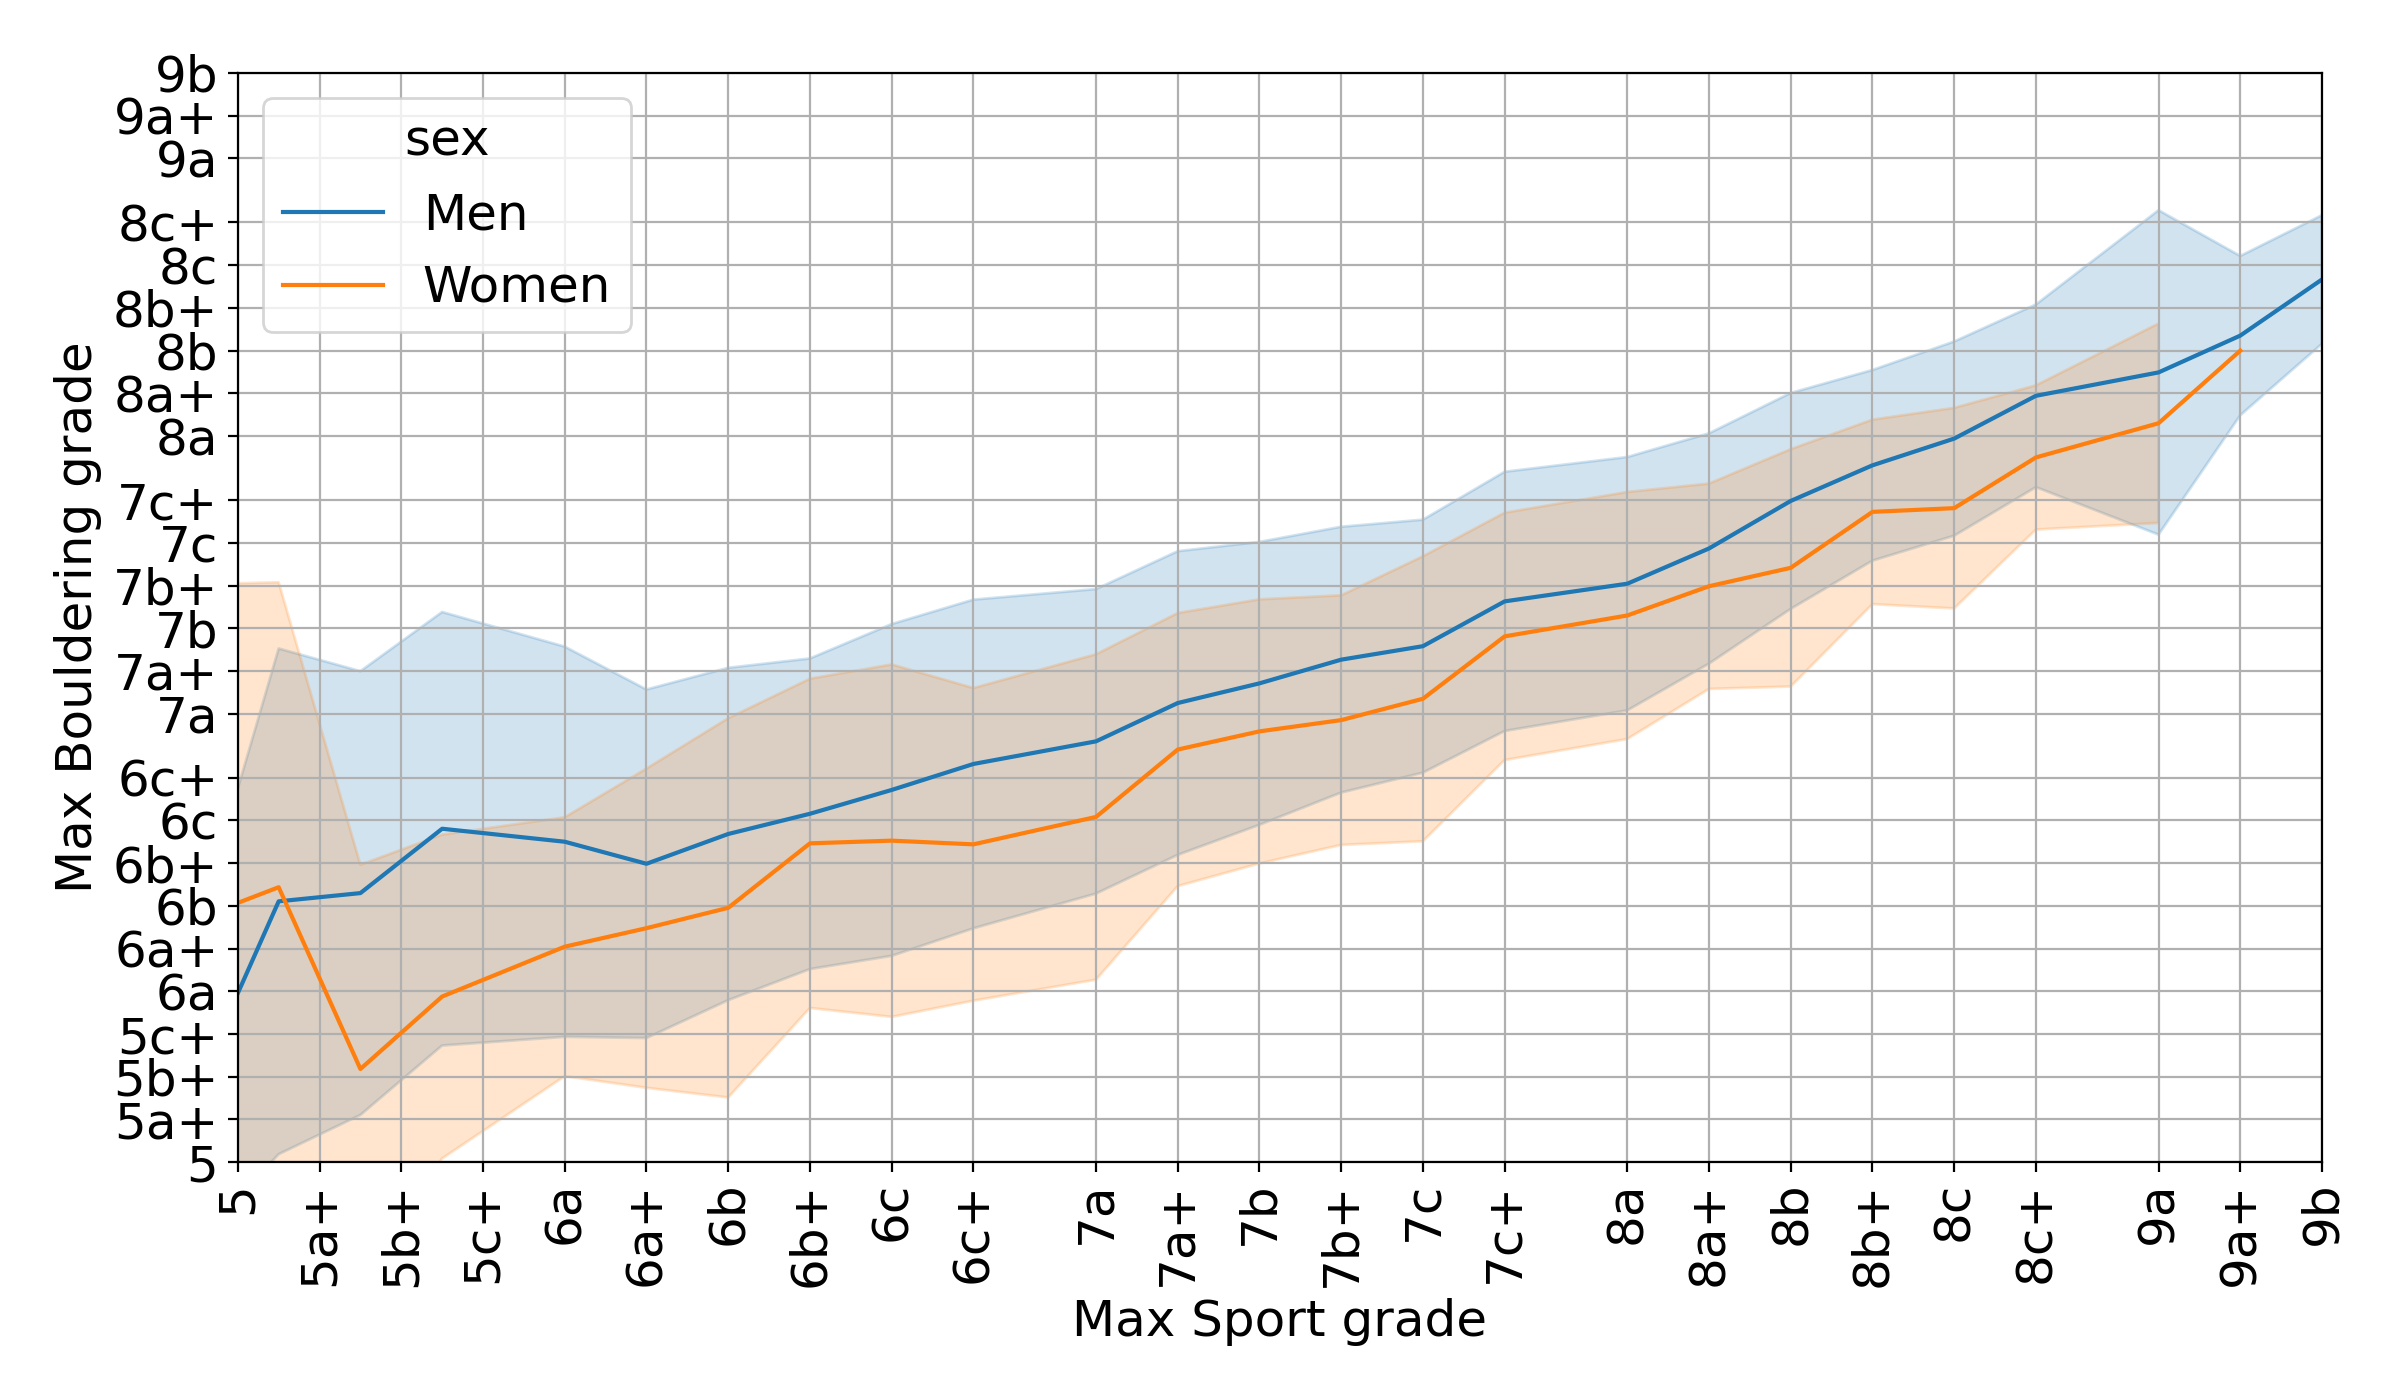
Another question that we can answer using data is how grades compare between bouldering and sport climbing. In sight of the next Paris 2024 Olympics, where sport climbing and bouldering will be combined for the same medal, it’s interesting to look at all the users in the dataset who practice both sport climbing and bouldering. Of the 30,844 total users who practice sport climbing and the 19,253 who practice bouldering, only 14,105 practice both disciplines. If we focus on this group of users, we can calculate their maximum grade for sport climbing, maximum grade for bouldering and plot them against each other.
Figure 7c Average maximum bouldering grade vs maximum sport climbing grade
In the first plot, we average the users’ maximum bouldering grades given their maximum redpoint, both for men and for women. From the plot, we can see that men who sport climb similar grades to women tend to climb slightly higher boulder grades than women, on average. For example, men who sport climb up to 7a tend to boulder up to 6C+/7A, whereas women who sport climb up to 7a have a maximum bouldering grade of 6C. However, if we invert the axis and plot the average maximum sport grade against the bouldering grade, things are different:
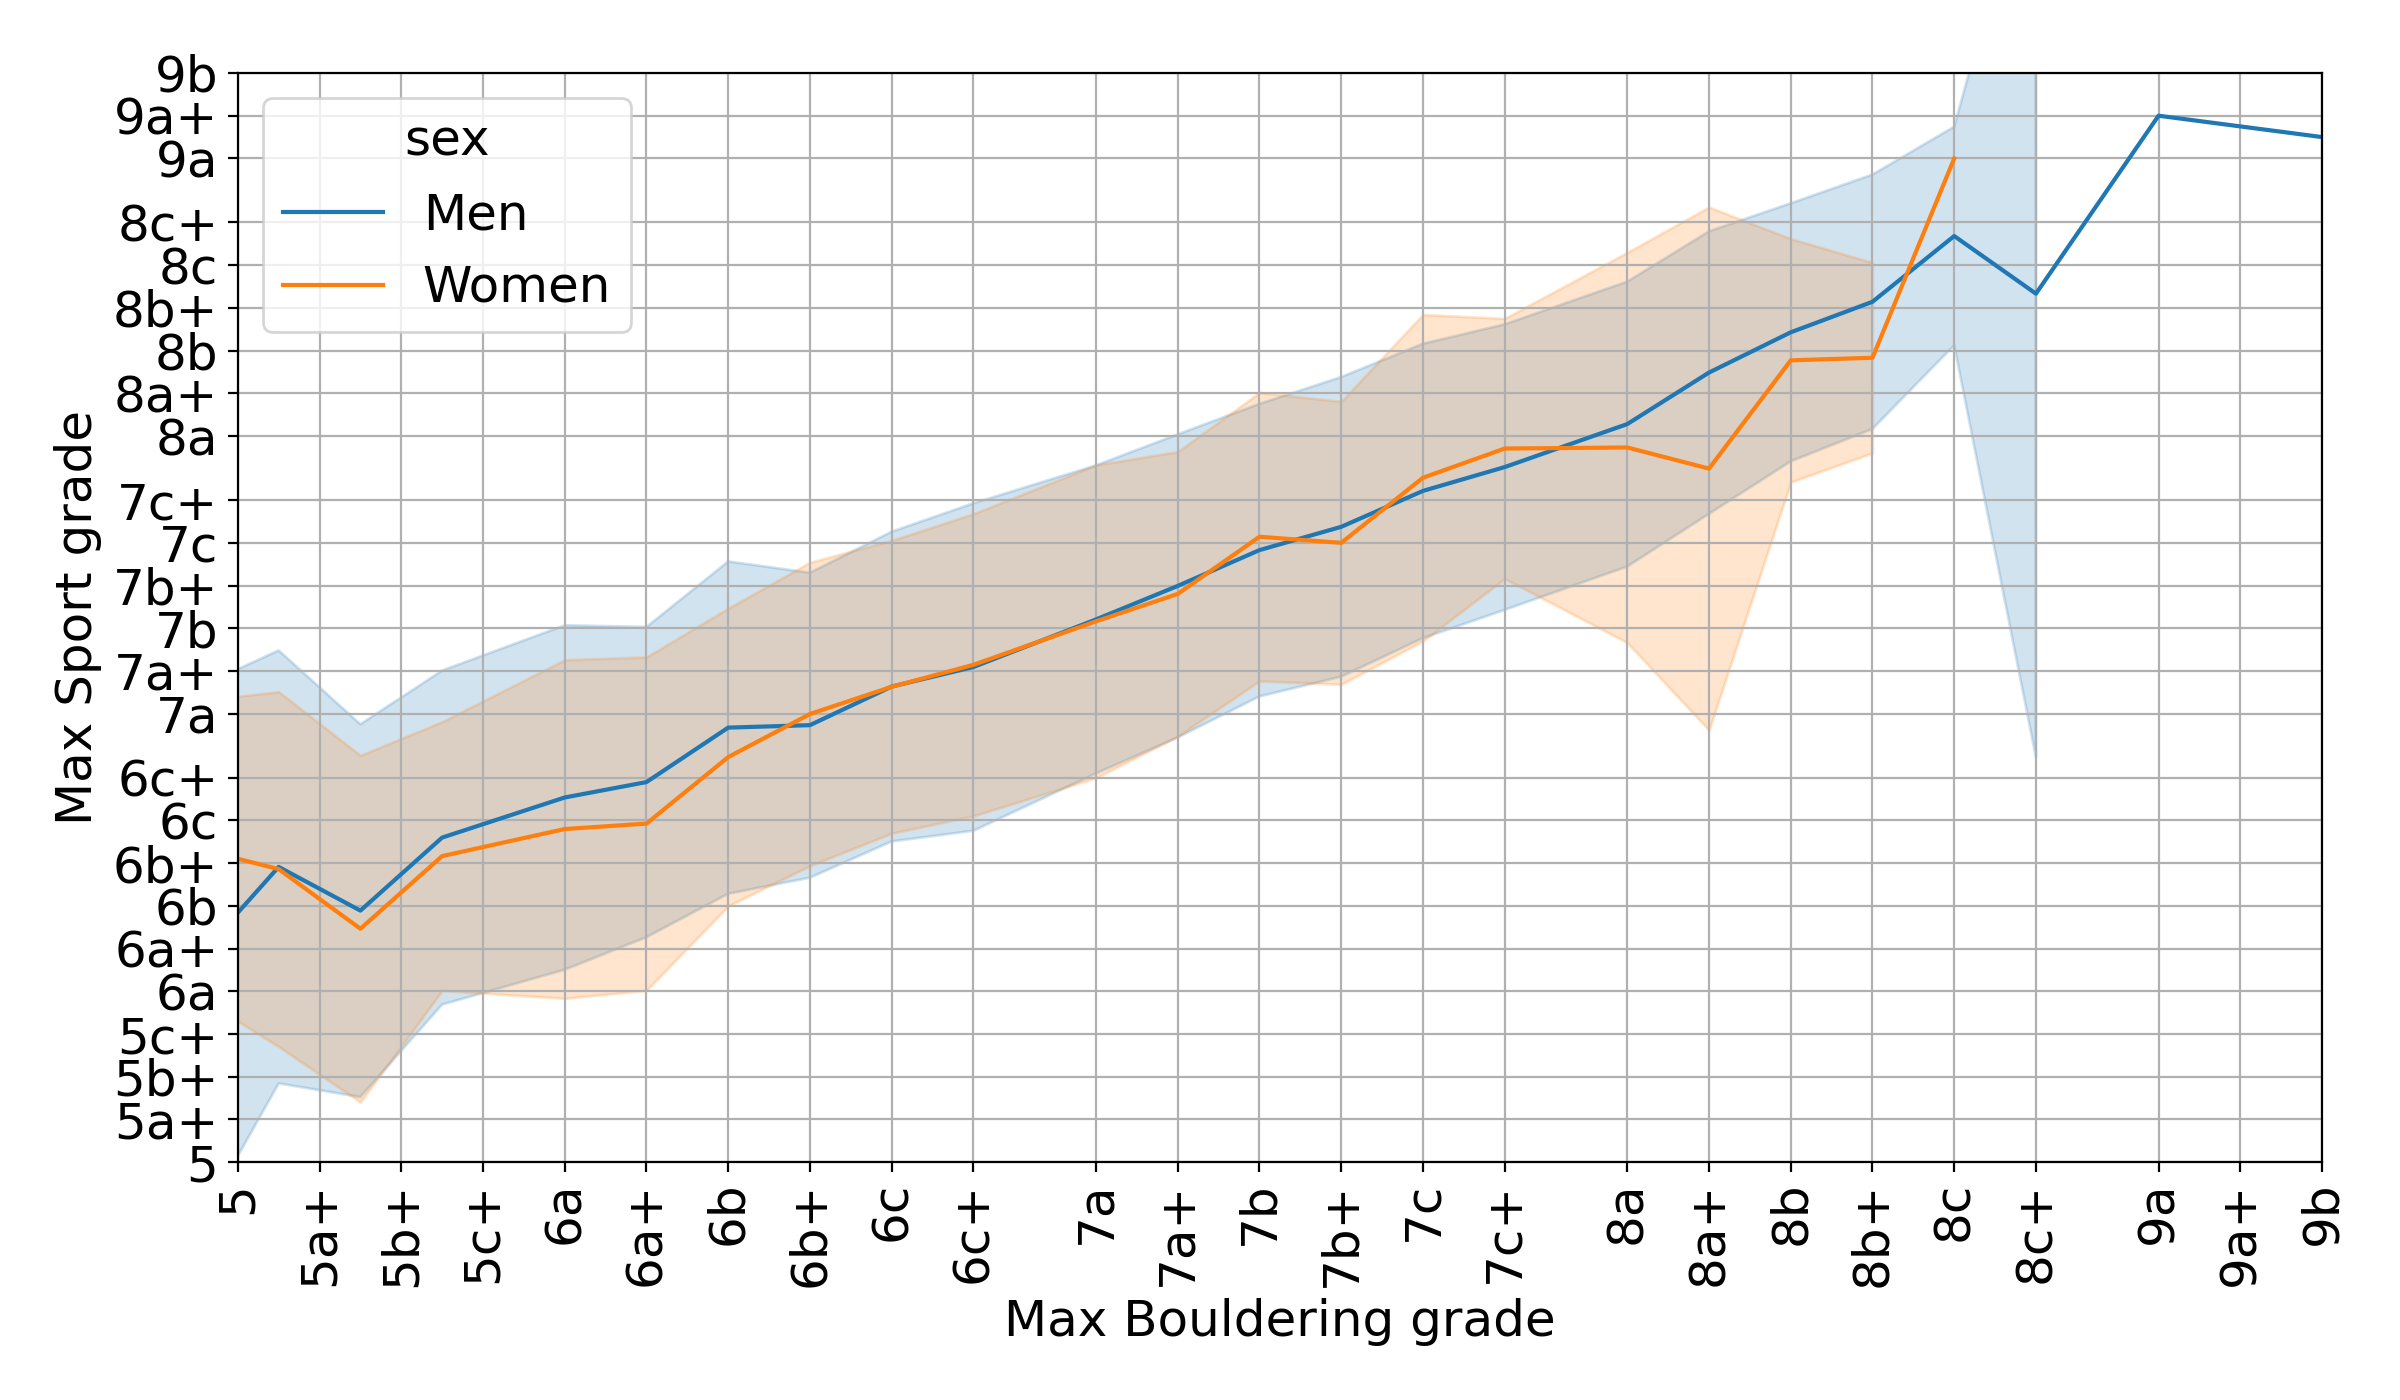
Figure 7d Average maximum sport climbing grade vs maximum bouldering grade
From this plot, we can see that men and women who boulder up to a grade between 6B+ and 8A have an average maximum redpoint grade which is pretty much identical.
“Practicing both bouldering and sport climbing, if you can boulder a 7A, you can probably sport climb a 7b.”
Progression of maximum redpoint
A different way to plot the data is to aggregate users first by how long
they’ve been climbing for and then average the grades they climb. If we
plot the variables in this way, the graph shows us the progression of
max redpoint for the average climber.
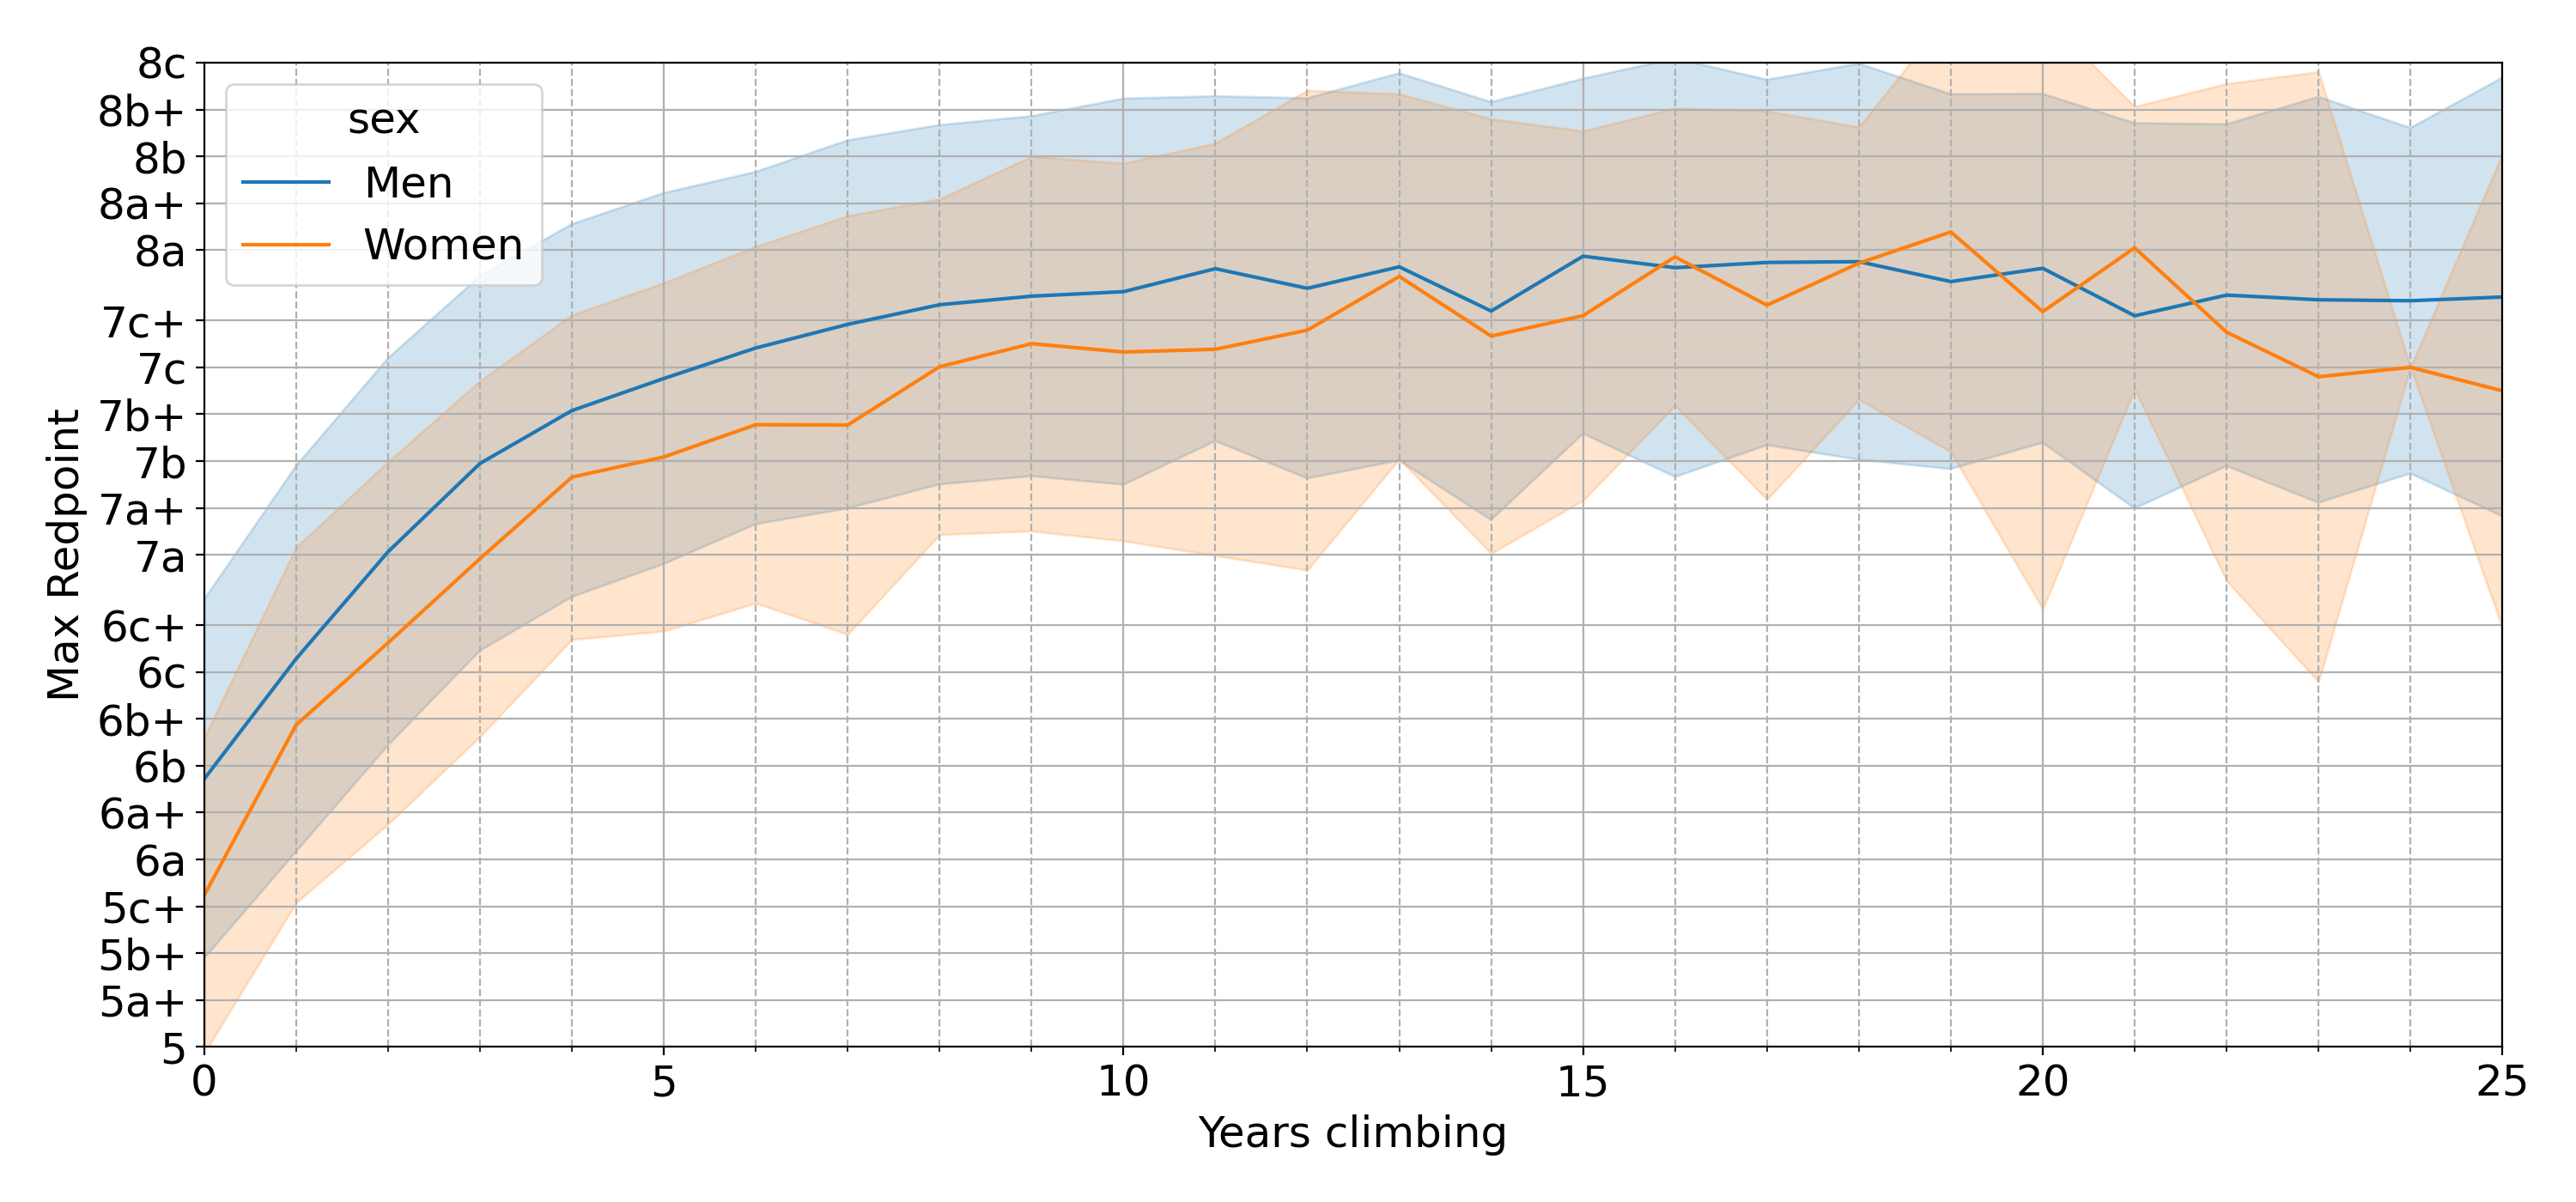
Figure 8 Average maximum grade for men and women climbers vs years since started climbing
Men start, on average, with a max redpoint of 6b, while women start just
below 6a. The progression is very similar for men and women, with the
average men climbing their first 7a in about 2 years and the average
women in 3. The curve seems to plateau around 8a after 10-15 years, with
men and women climbing around similar grades at that point. You can see
from this plot that the curve doesn’t even get close to grades in the
9s, because the average climber, no matter how long they’ve been
climbing for, will never climb harder than 8a.
It’s important to notice that the meaning of this plot is slightly
different from the previous one in Figure 5. While the plot in Figure 5 shows the average
number of years required to climb a specific grade, this plot shows the
average grade climbed by users that have been climbing for a specific
amount years. More details about this can be found in the appendix (A3).
Improvement over years and plateau
A comment that I often hear among climbers is the feeling of having
plateaued and not improving anymore. So, let’s try to answer this
question: “when does the average climber plateau?”. Given the data from
the previous plot, we can calculate the derivative for max redpoint with
respect to time. Since the data is noisy, I used a Savitzky-Golay filter
to calculate the numerical derivatives.
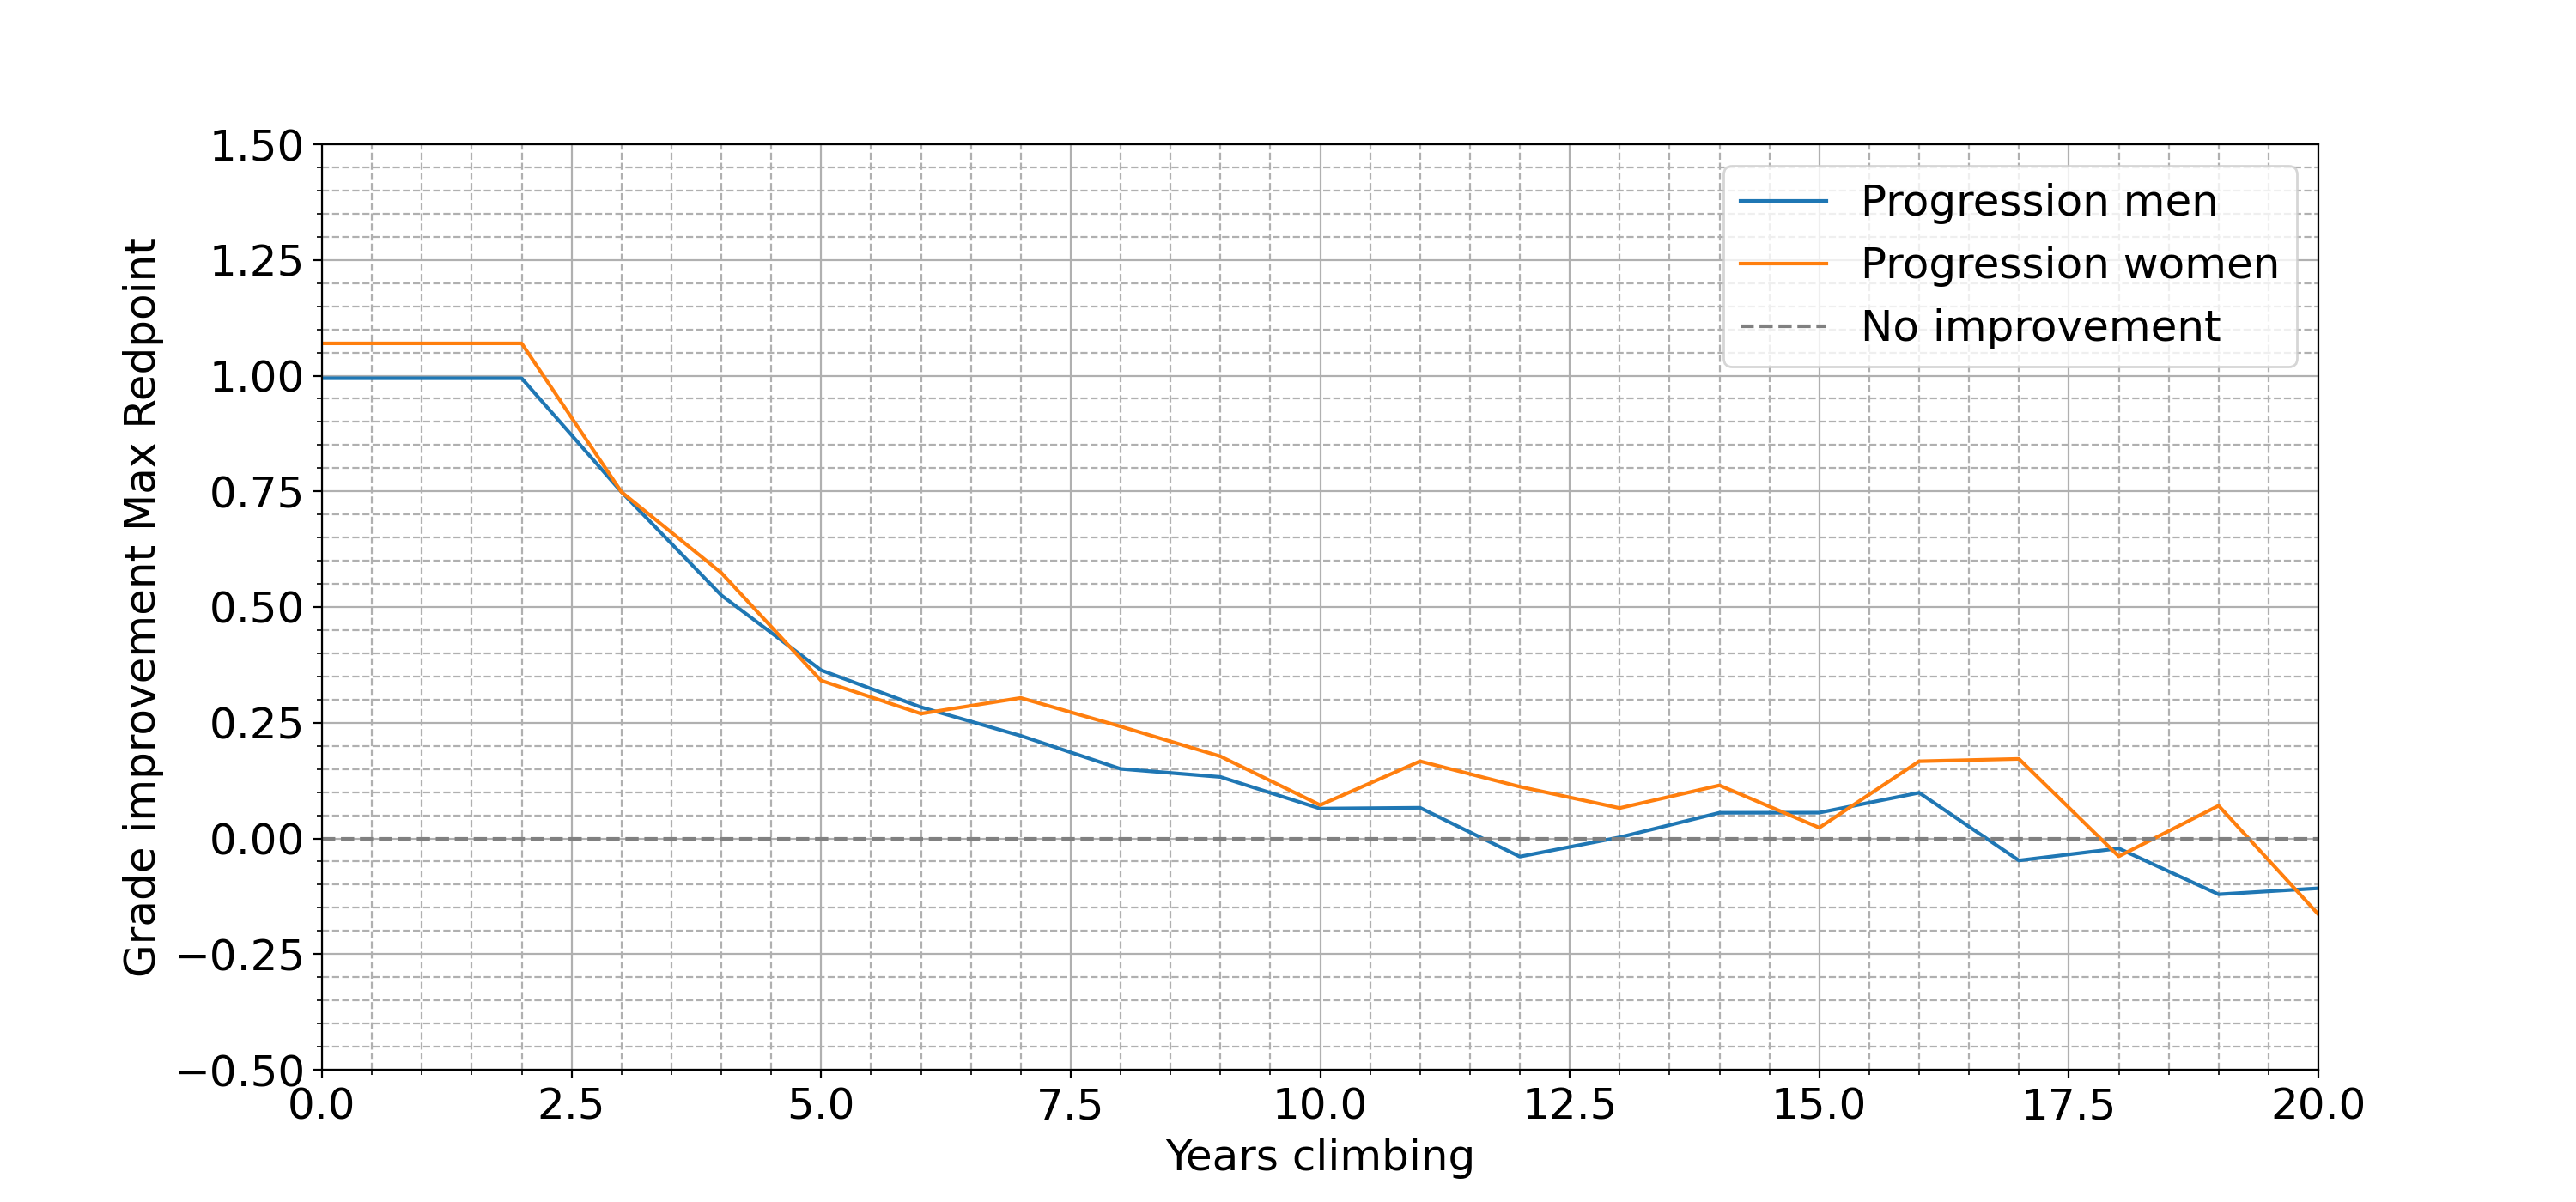
Figure 9 Average maximum grade improvement (derivative) for men and women climbers vs years since started climbing
The plot shows that for the first 2-3 years, climbers improve on average
one whole grade per year (6a, 6b, etc.). After 4 years, the improvement
is in the range of a “plus” (0.5 of a grade in the plot), whereas after
6 years the improvement becomes less than a quarter of a grade. From
this point on, the improvement becomes less than the minimum difference
that we use to grade two routes, and this is probably what causes that
feeling of plateau that I was talking about. It’s important to remember,
however, that improvement is not just sending the next grade, but also
how confident you feel when you’re sending a certain grade and how many
attempts it takes to send it.
The actual plateau can be estimated by looking at the point where the
derivative crosses the horizontal axis (dashed grey line) for the first
time, which is 11-12 years for men and 18 years for women. Please keep
in mind that the amount of data in this range is very limited and the
exact number of years before the plateau is very noisy.
“The average climber reaches a plateau between 7c+ and 8a in around 11-12 years.”
Progression for different age
We all know that whichever activity or sport you do, the earlier you start in your life, the faster (or further) you progress. But how does it apply to climbing, and what does the data say about it? Let’s explore the field “date of birth” in the dataset to see at what age users from this dataset started climbing:
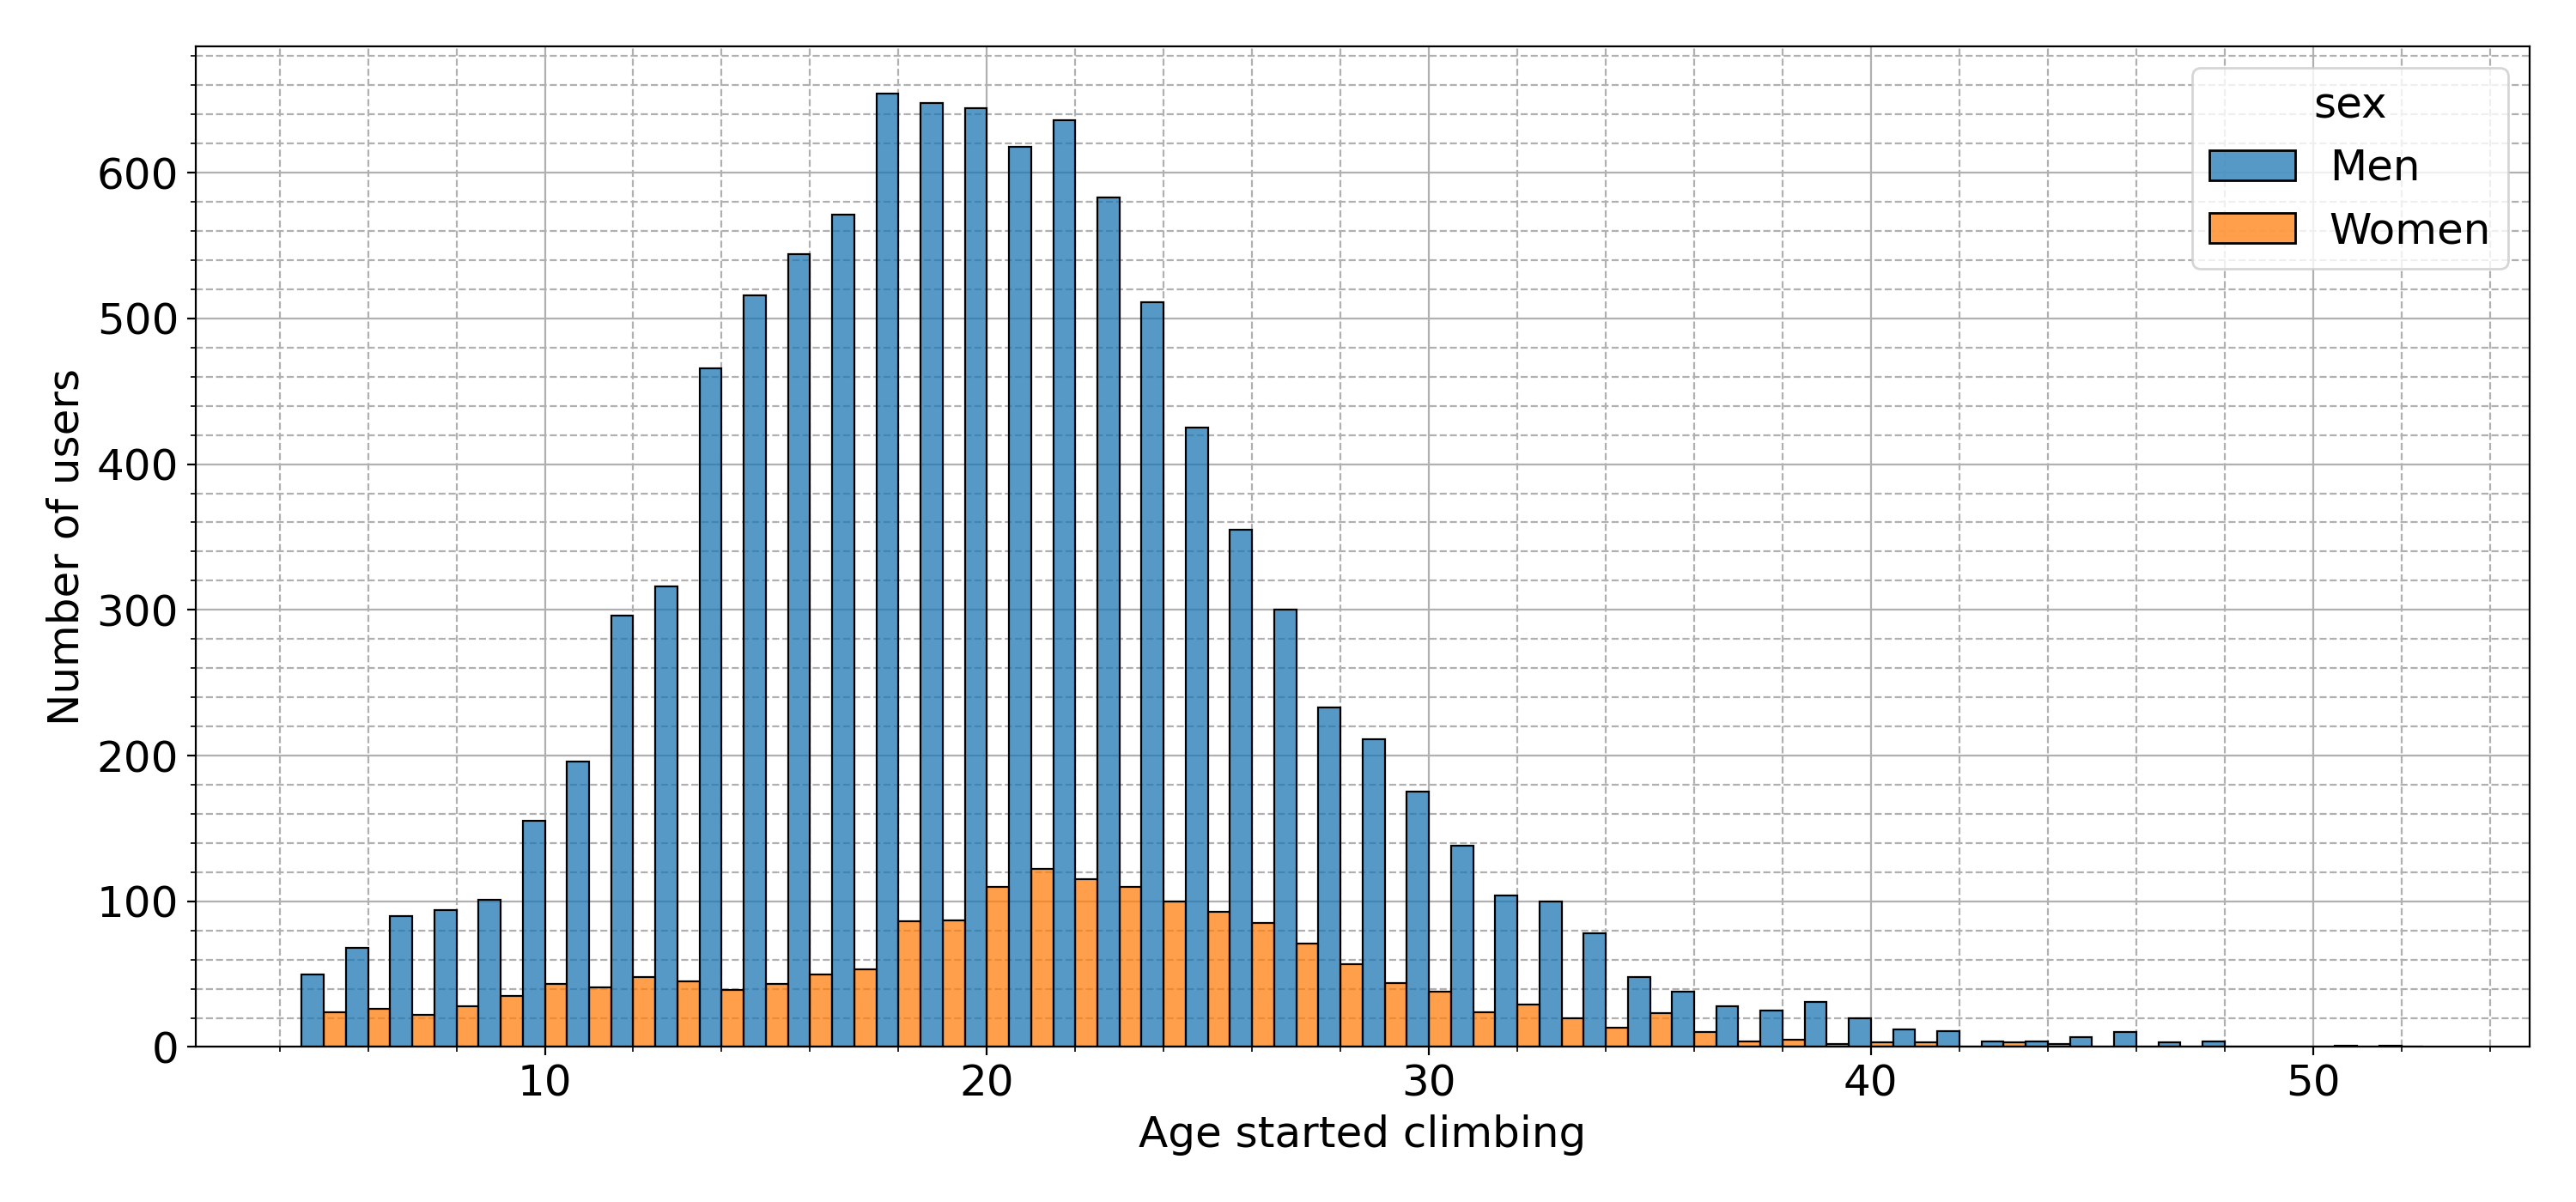
Figure 9b Histograme of age at which users started climbing
From the histogram, we can see that the majority of users started climbing between age 18-22, with the average men starting slightly sooner than the average woman. How does the age users start climbing affect the maximum grade they can achieve? Let’s look at a similar figure as the previous section, arranged this time by age group:
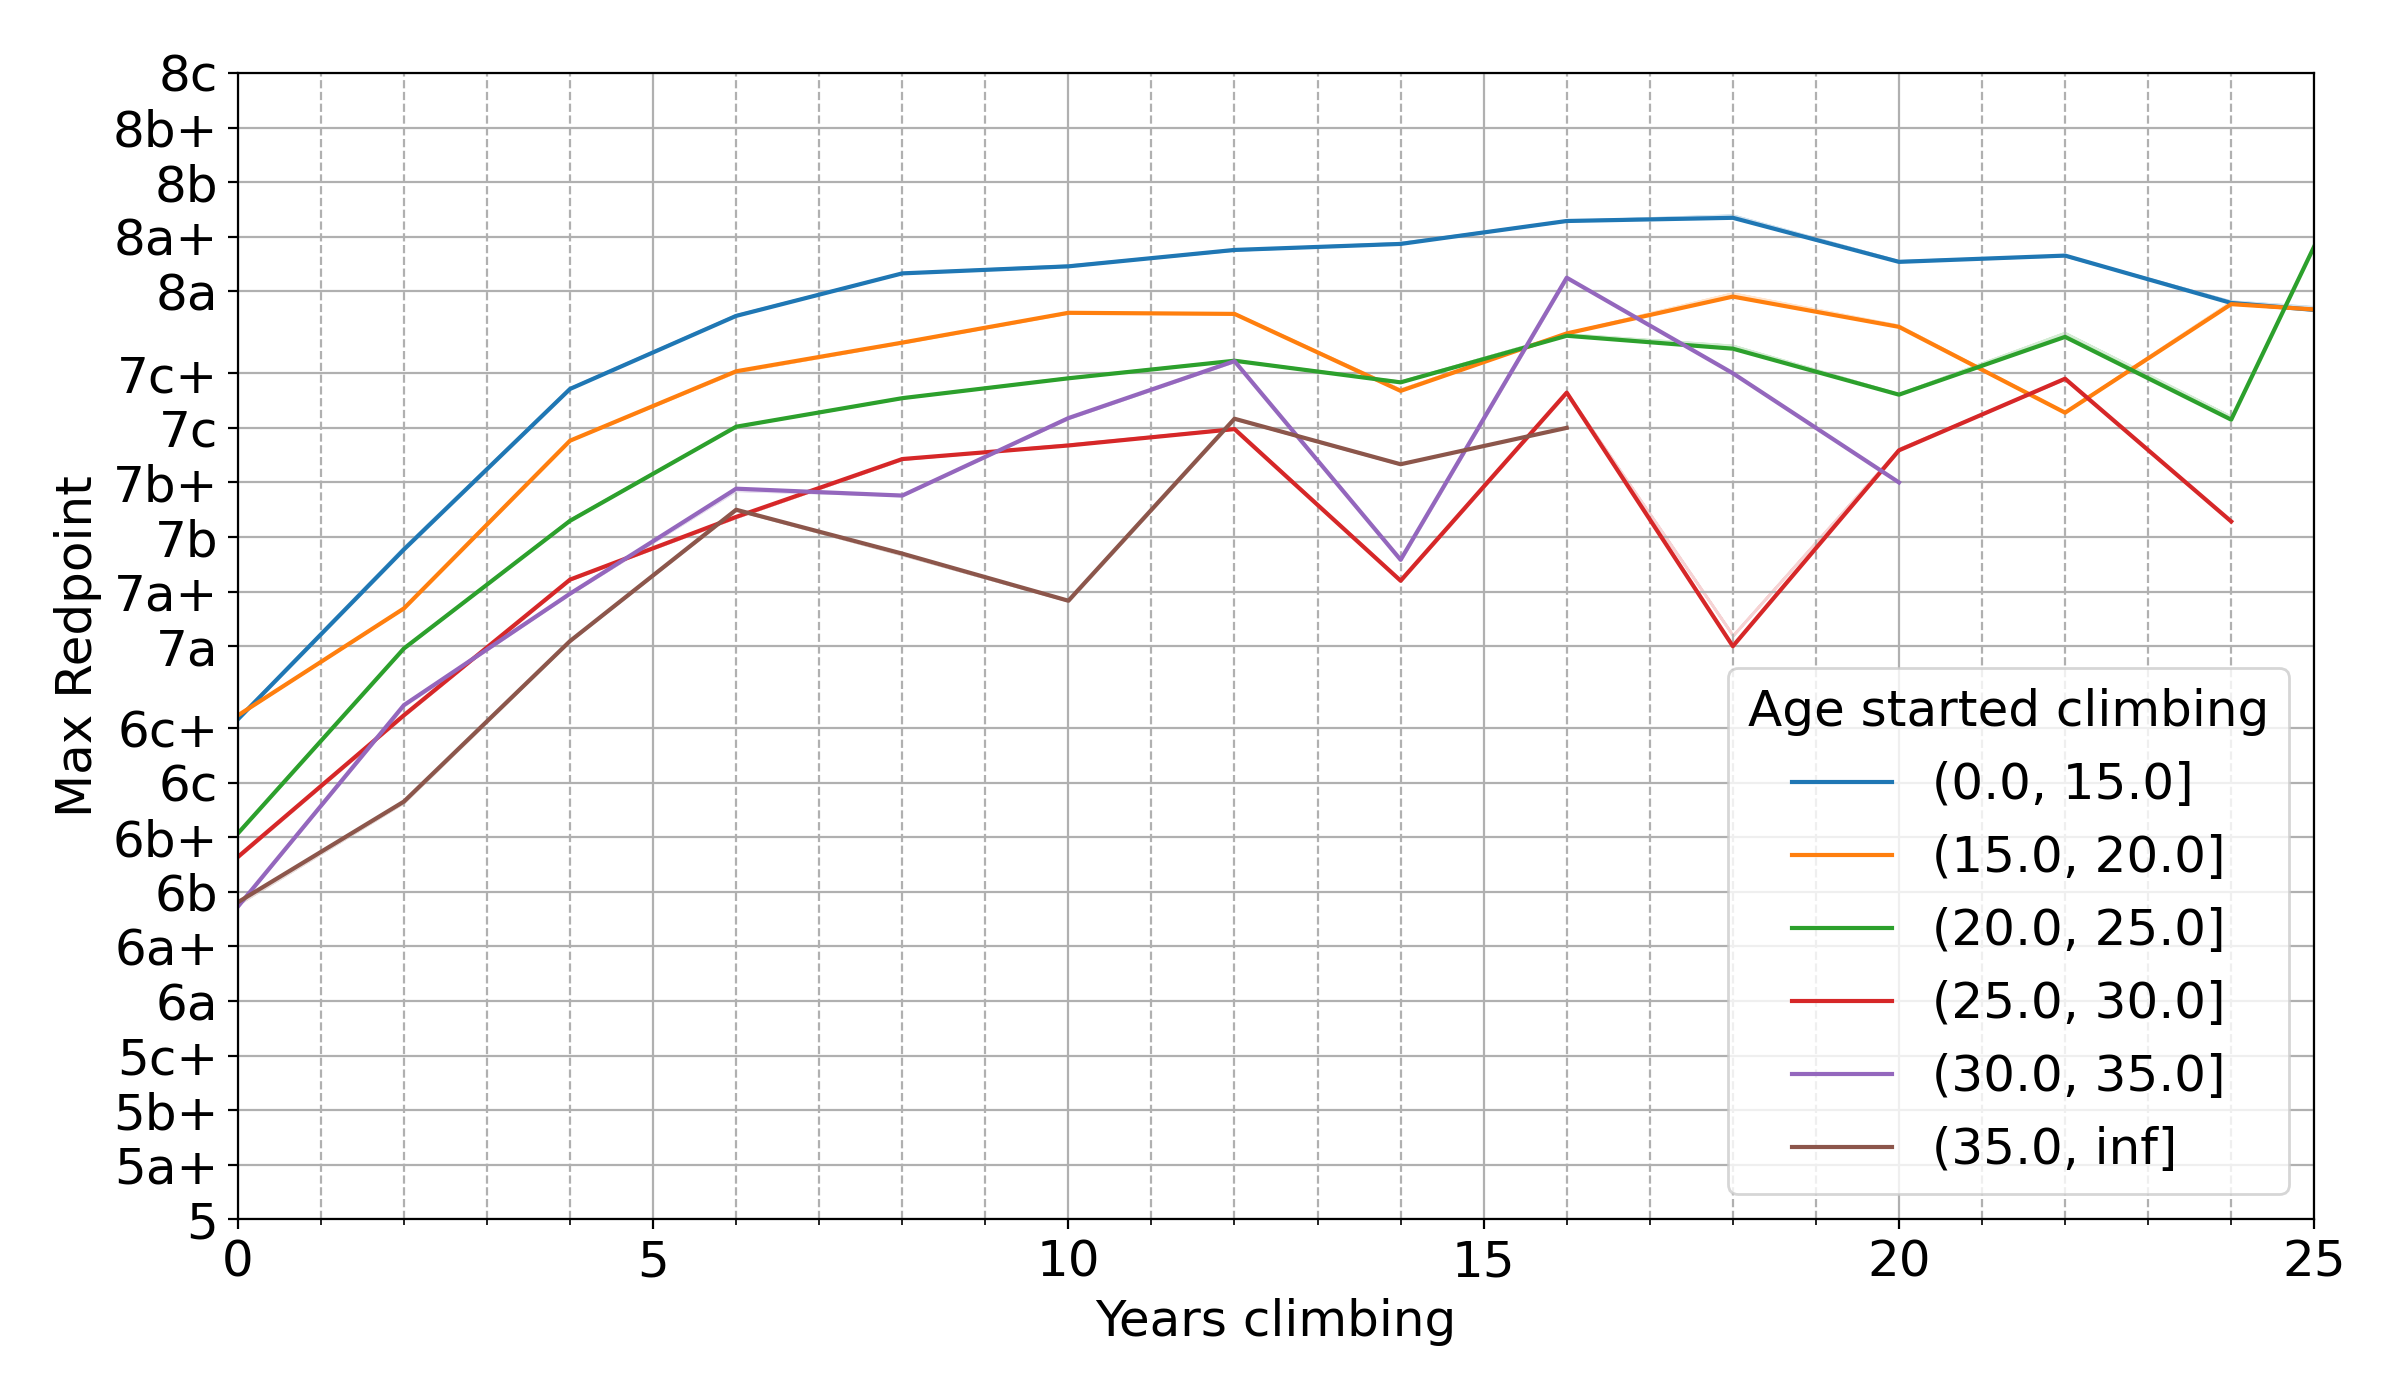
Figure 9c Average maximum grade for different age groups vs years since they started climbing
The plot gets noisier as the age started climbing and the grade increase, but we can clearly see a pattern. Climbers who start the earliest (age 0-15) not only start with higher grades, but they also achieve a higher maximum grade in their career, which is above 8a+. As the age users start climbing goes up, the maximum grade achieved goes down, with a max of 8a for age group 15-20, 7c+/8a for age group 20-25 and 7c/7c+ for climber who started later than 25.
What is interesting from this plot is that the progression curves for all the age groups seem to be parallel and simply shifted downwards as age increases. Kids will climb form 6c+ to 7c/+ (2.5 grades) in 4 years, while older climbers will improve from 6b to 7a+ (2.5 grades) in the same amount of years.
Progression for different height
An interesting parameter that is saved in the dataset is the users’ height. Unfortunately, only half of the users set the
height in their profile, but we can try to get an idea of how height
affects progress. For this analysis, it’s important to differentiate
between men and women, since the distribution of height is different.
However, due to the reduced amount of data for women (n= 2854), these
results are not very reliable. I also restricted the analysis to sport
climbing only because I didn’t have enough bouldering data to produce a
clean plot. I broke down the height into three different categories by
ensuring that each bin had equal number of users. For men, the breakdown
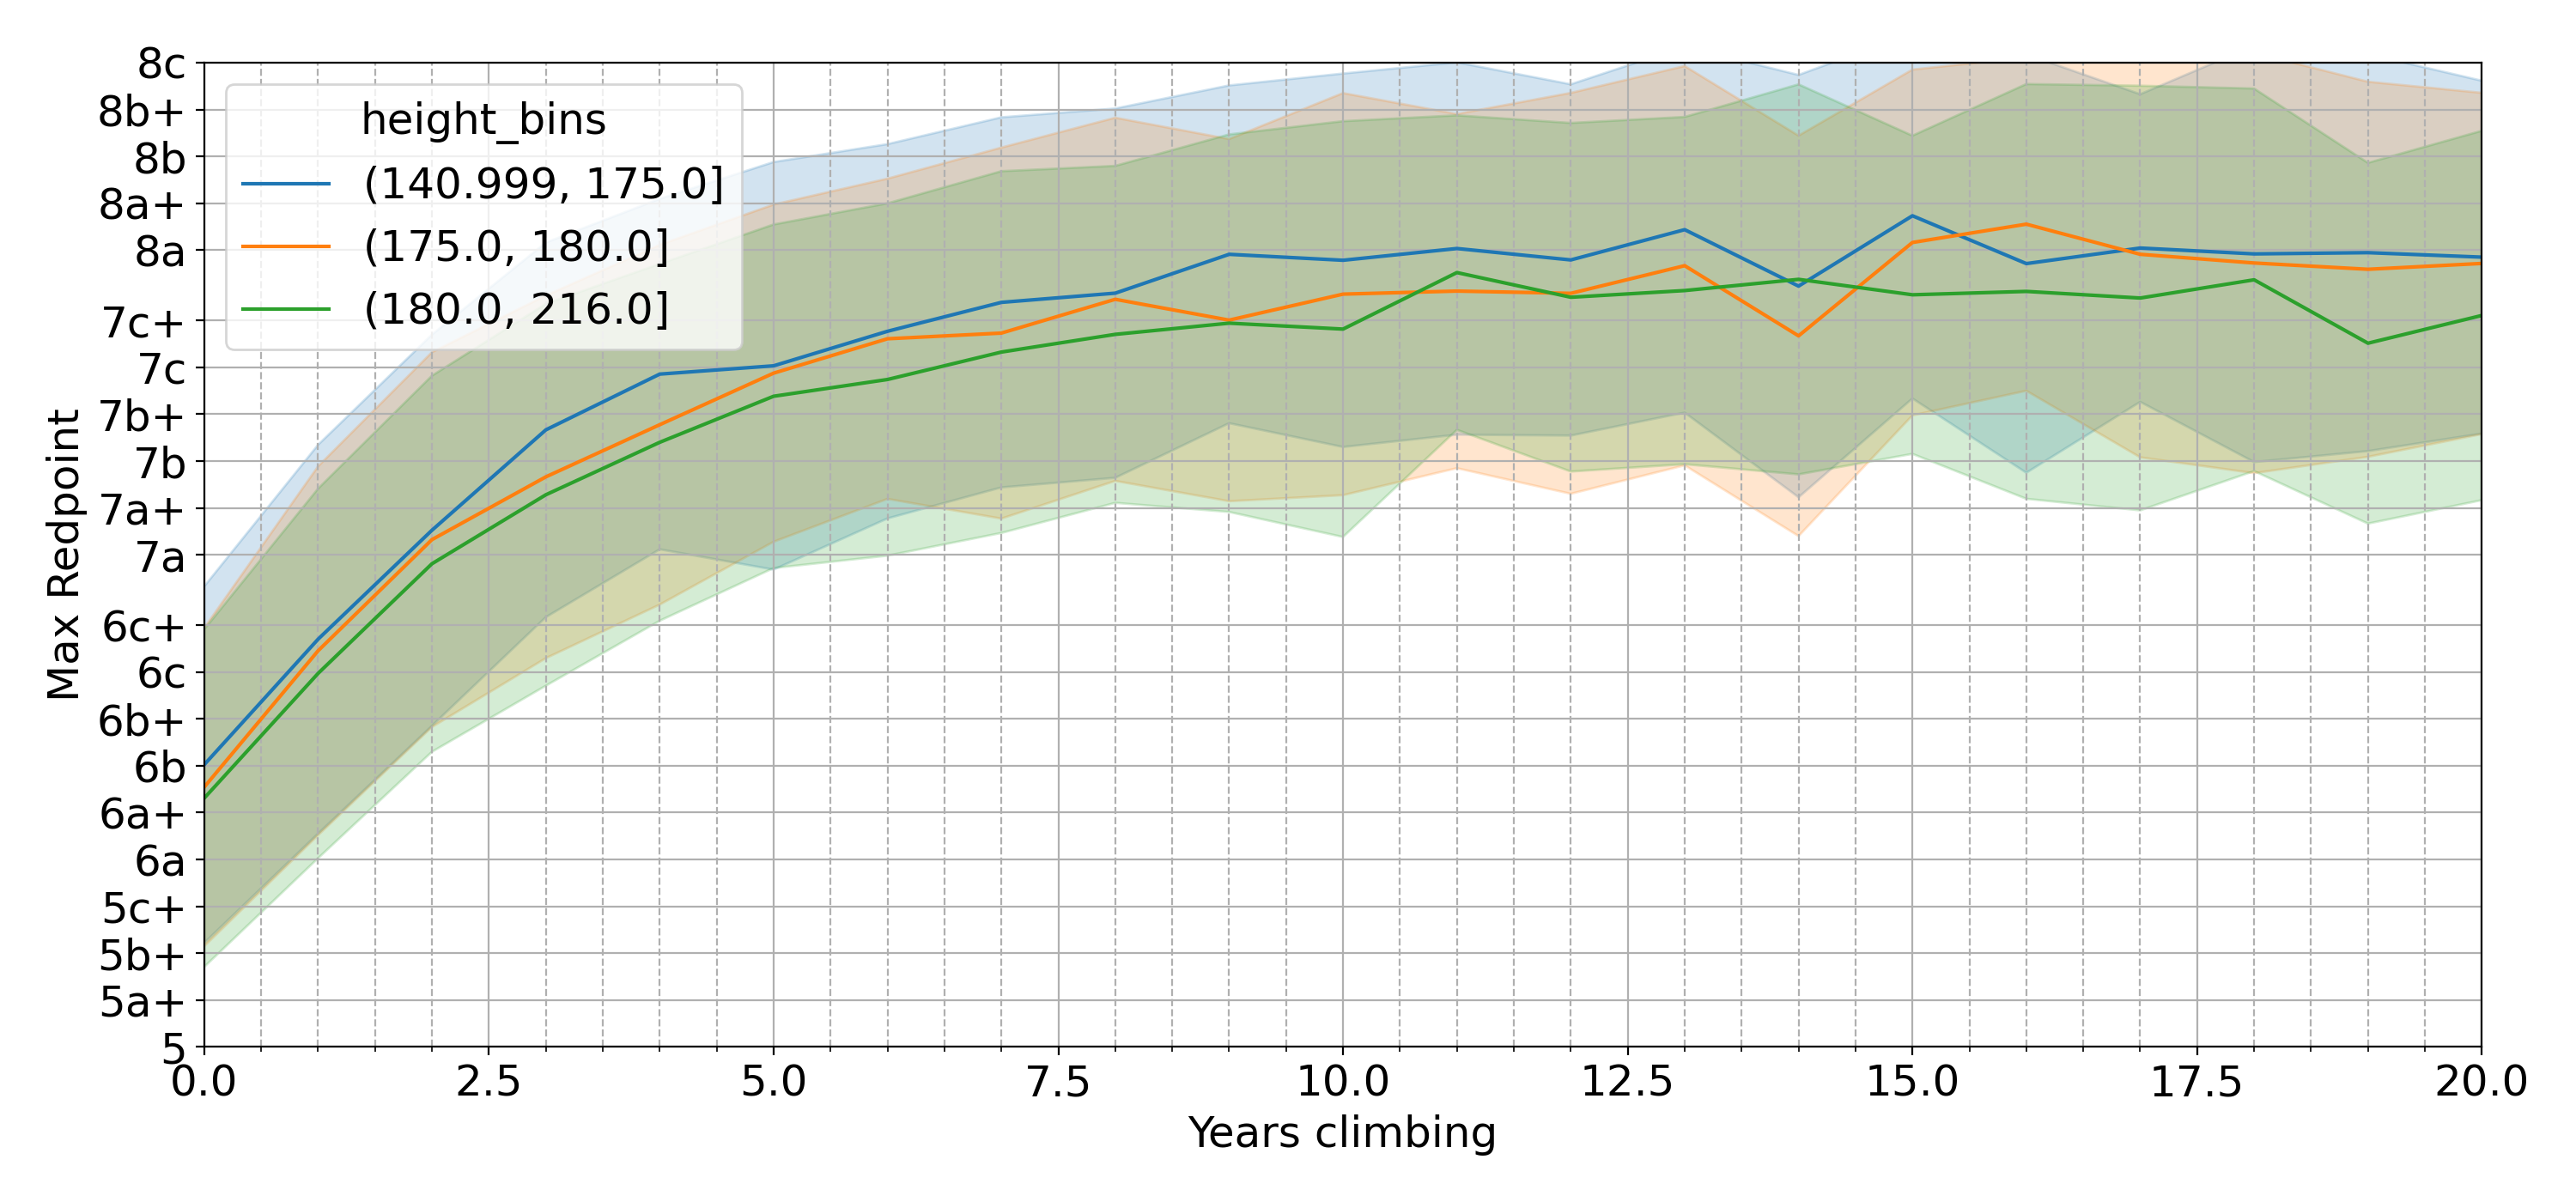
of height produced three categories of 141-175 cm (short), 175-180 cm
(medium) and 180-216 cm (tall).
Figure 10 Average maximum grade for men clustered by height vs years since started climbing
From this plot, we can see that short climbers seem to be the ones that
progress faster, with medium climbers in the middle and tall climbers
progressing the slowest. The data, however, is very noisy and it’s
difficult to draw any valuable conclusions.
“Men that are 141-175 cm tall seem to progress slightly faster than men that are 180-216 cm”
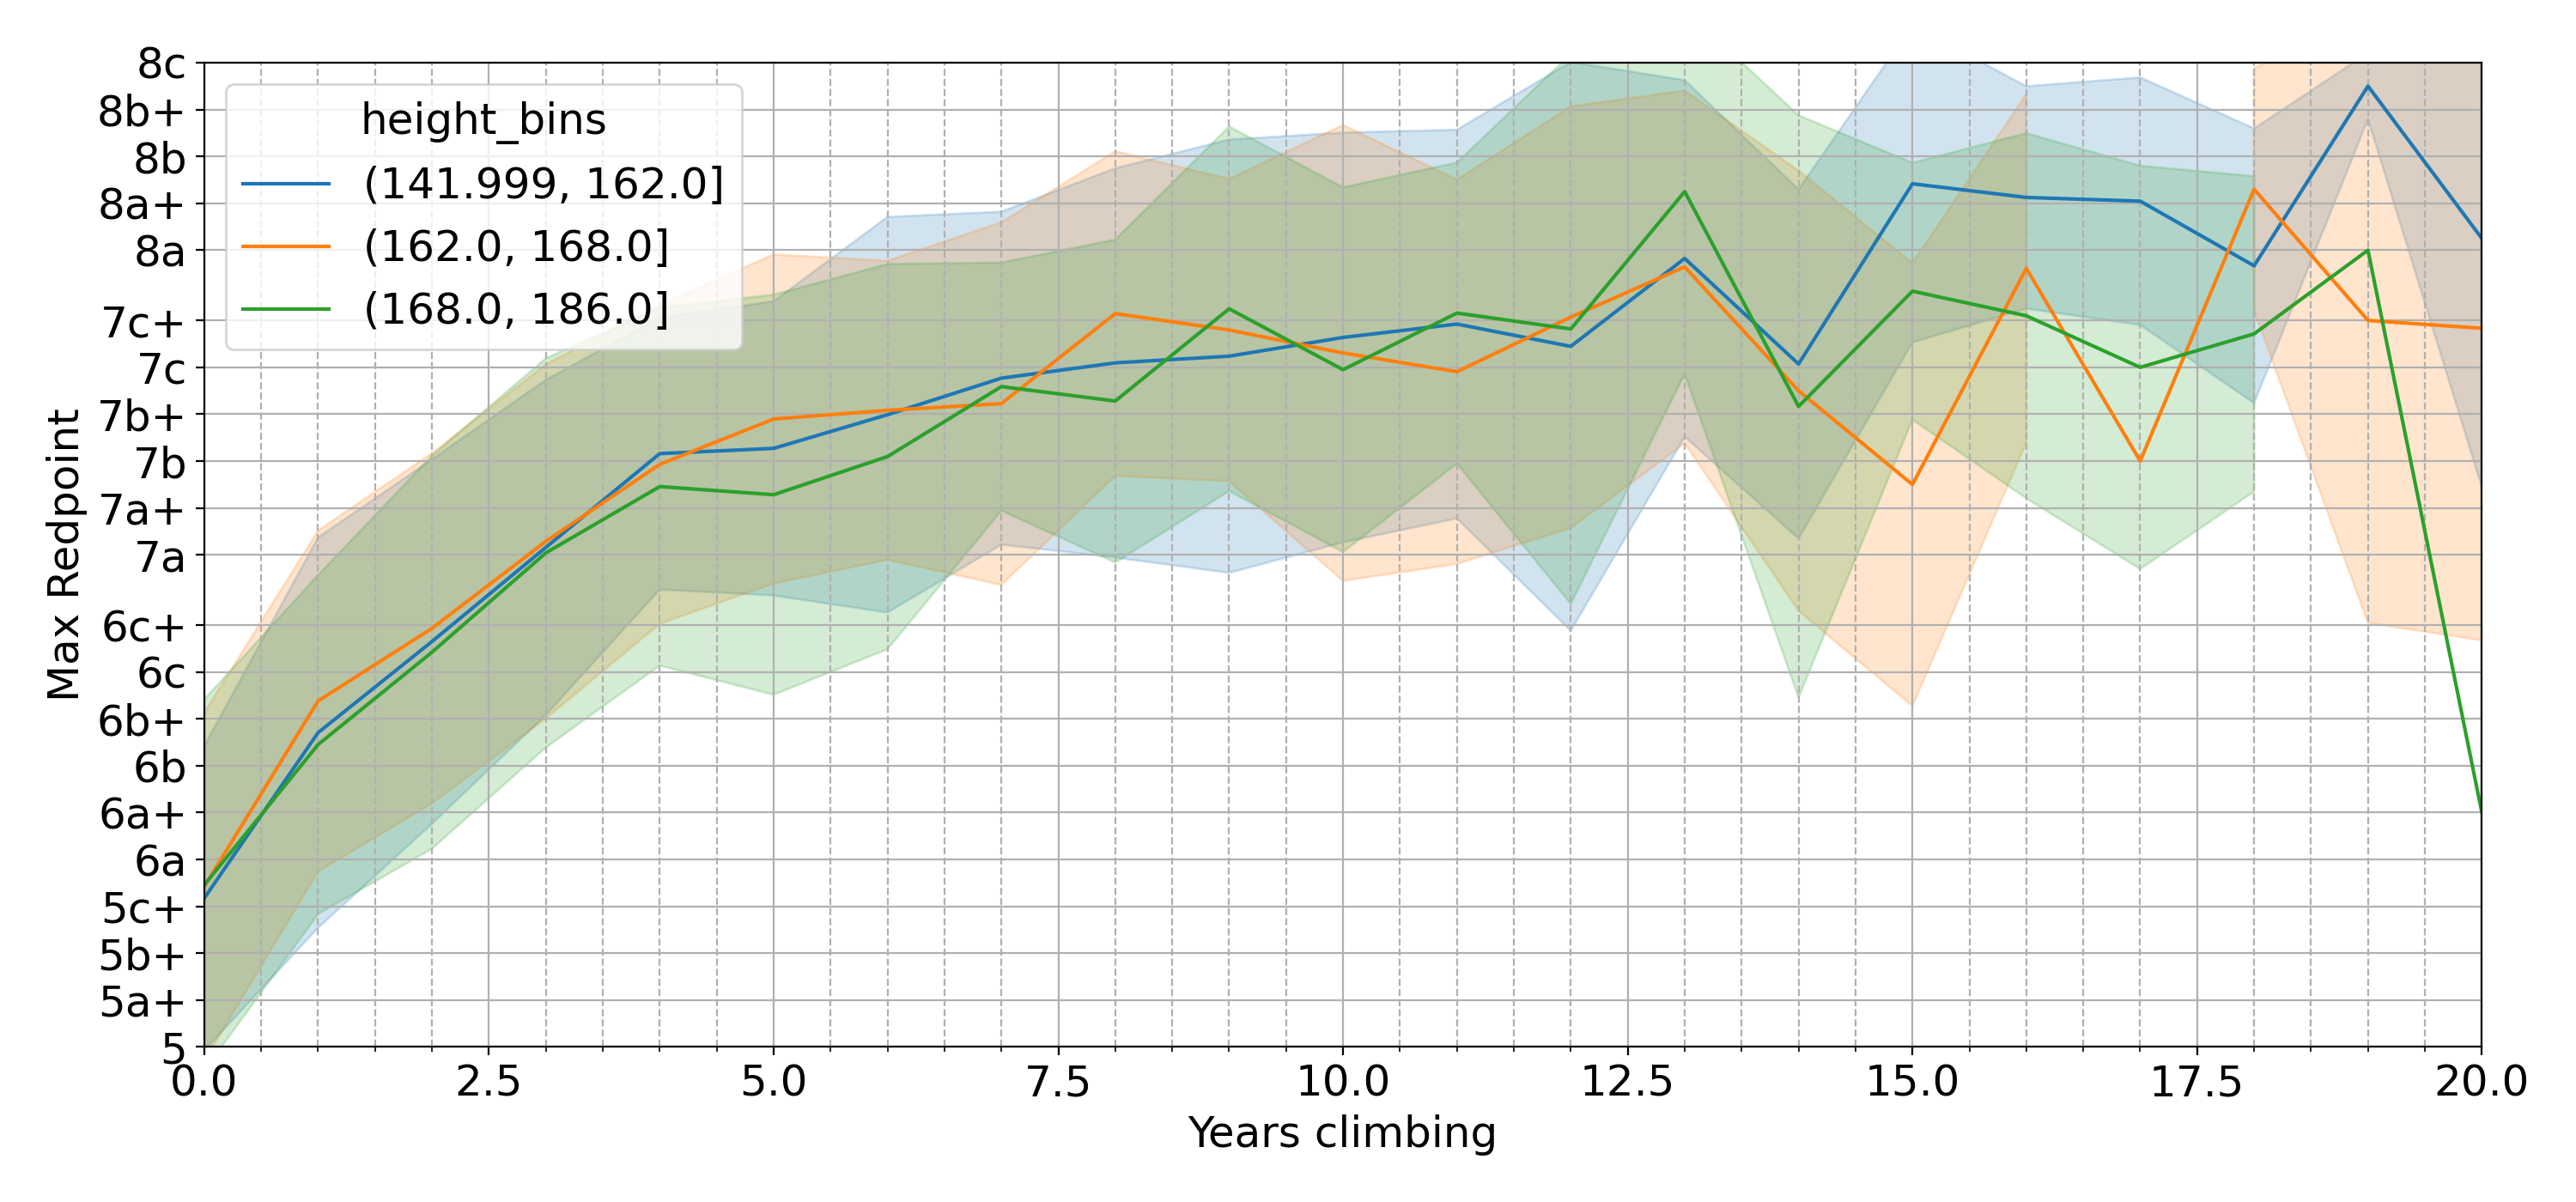
For women, the height bins were 142-162 cm (short), 162-168 cm (medium)
and 168-186 cm (tall).
Figure 11 Average maximum grade for women clustered by height vs years since started climbing
The plot is even noisier than for men, due to the reduced amount of data.
It’s impossible to draw any conclusion but I’ll leave it here for
completeness.
Maximum grade for different height
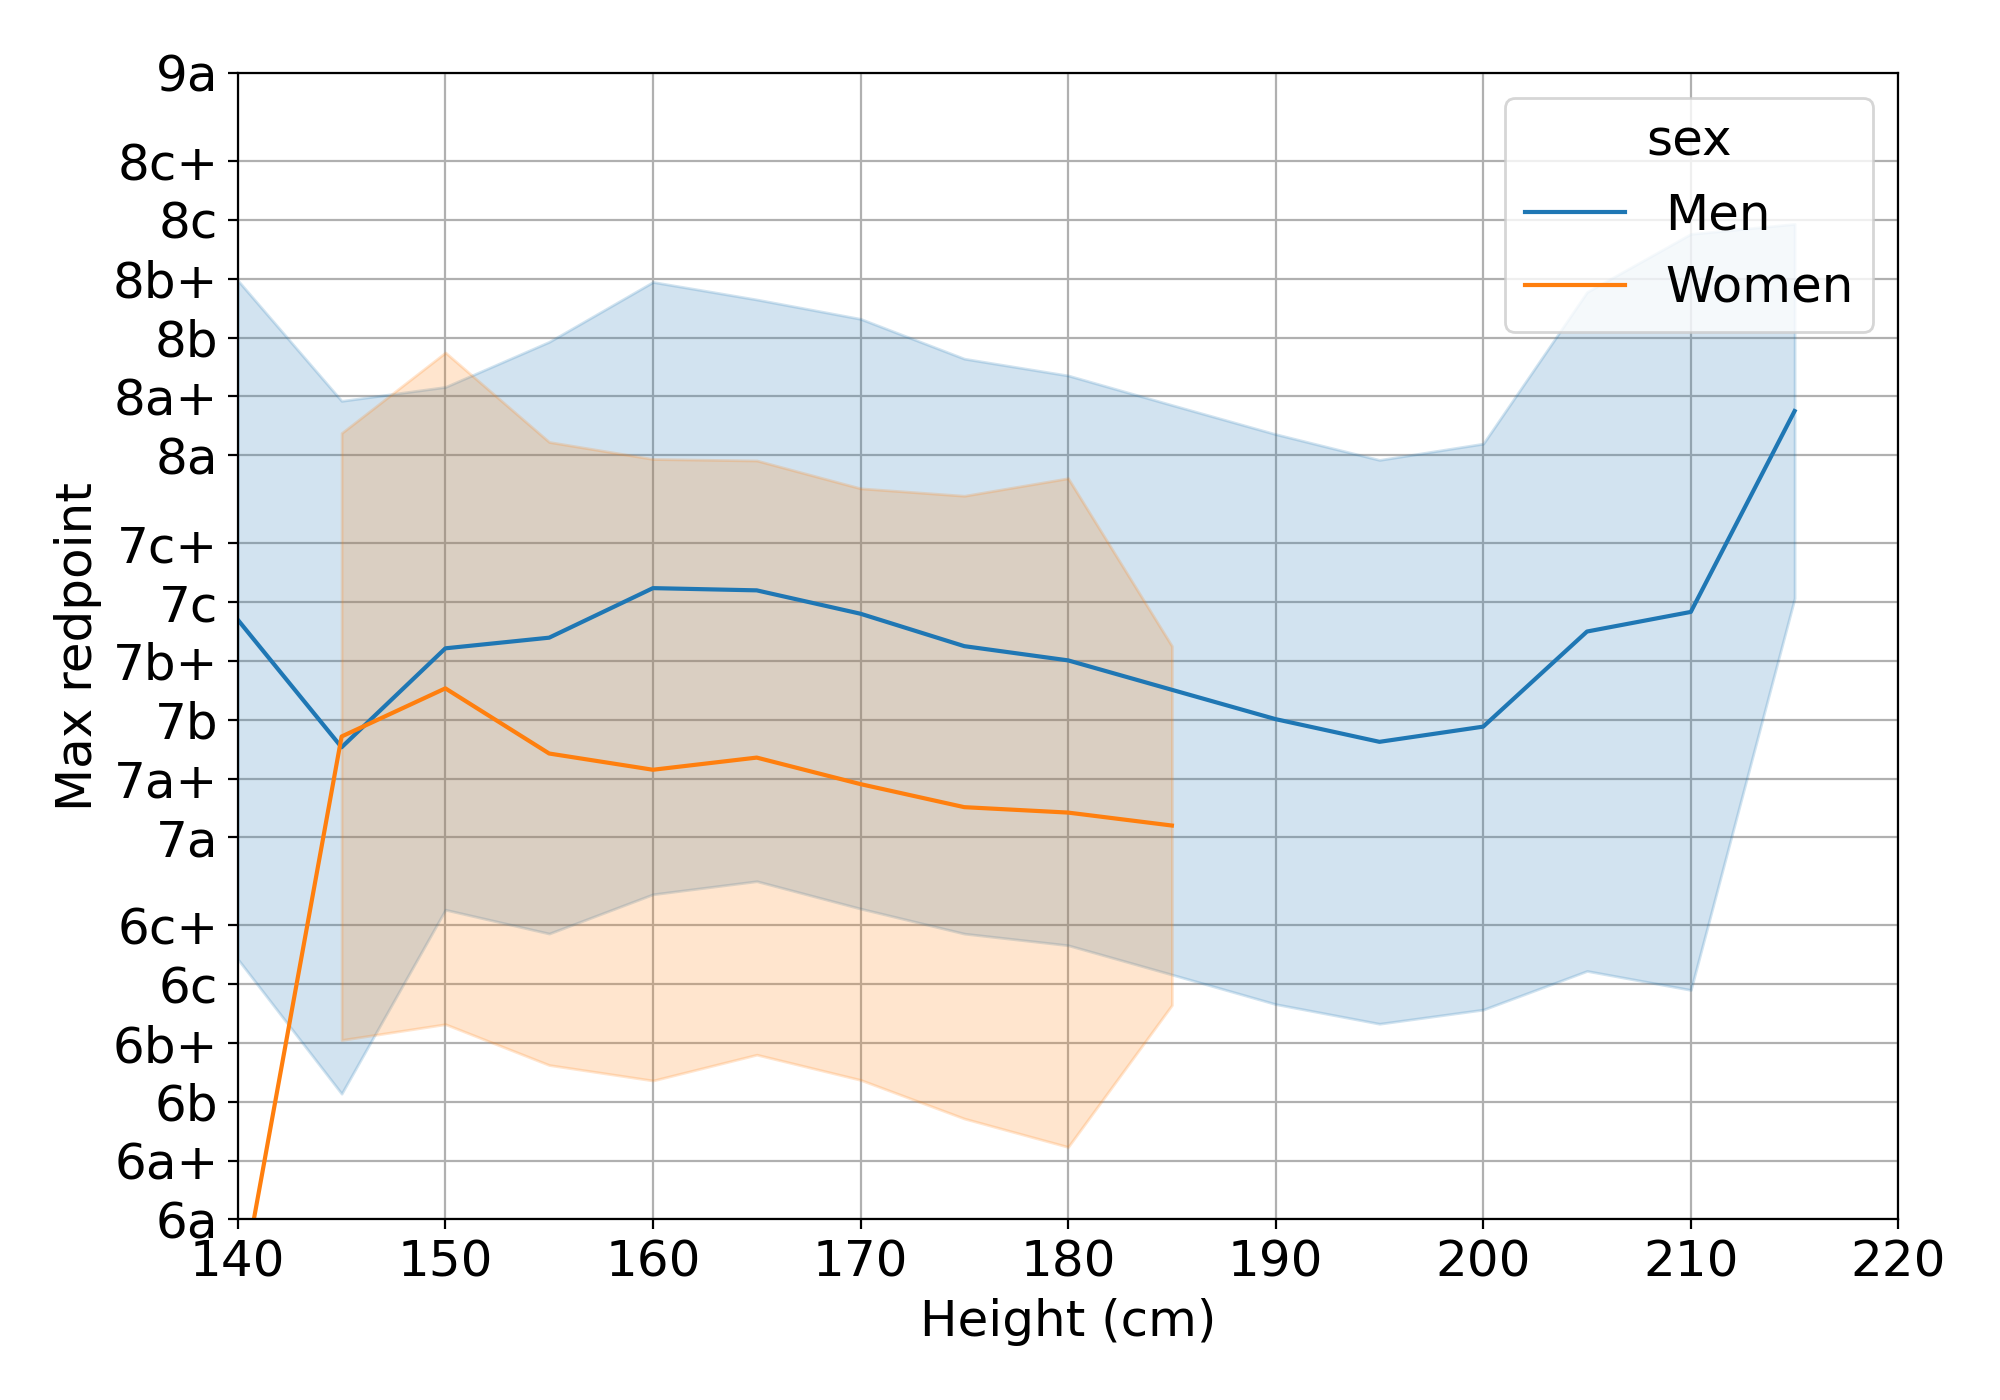
Instead of looking at the progression of climbers for different heigh groups, we can try to estimate the average maximum grade sent by climbers grouped by age. For this analysis, I reduced the precision of height to 5 cm (150, 155, 160, etc.) and calculated the average maximum redpoint for each height.
Figure 11b Average sport grade for men and women, aggregated by height
The results are still very noisy but we can see that there’s a correlation between height and the maximum redpoint. Men that are shorter than 150 cm and taller than 180 cm seem to climb the worst, although climbers taller than 210 cm reach the highest max redpoints. If a route is 8a because of a difficult crux and a very tall climber can skip it by reaching for the next holds, I can imagine how very tall climbers show higher average grades. Excluding very tall (>200 cm) climbers, the best height for men seems to be between 160-170 cm. For women, the data is more noisy, but we can see that 150 cm seems to be the best height, with the maximum grade going down with height from there on.
“Men that are between 190-200 cm seem to be the most negatively affected by height. The best height seems to be between 160 cm and 170 cm.”
Please note that these results refer to the maximum redpoint for each individual user, whichever the route they climbed. However, the same route could feel like a 7a for a tall climber and 7b for a short one, and the other way around. Also, keep in mind that correlation doesn’t mean causation and trying to understand how height affects climbing is a topic for a different article.
Number of ticks before the next grade
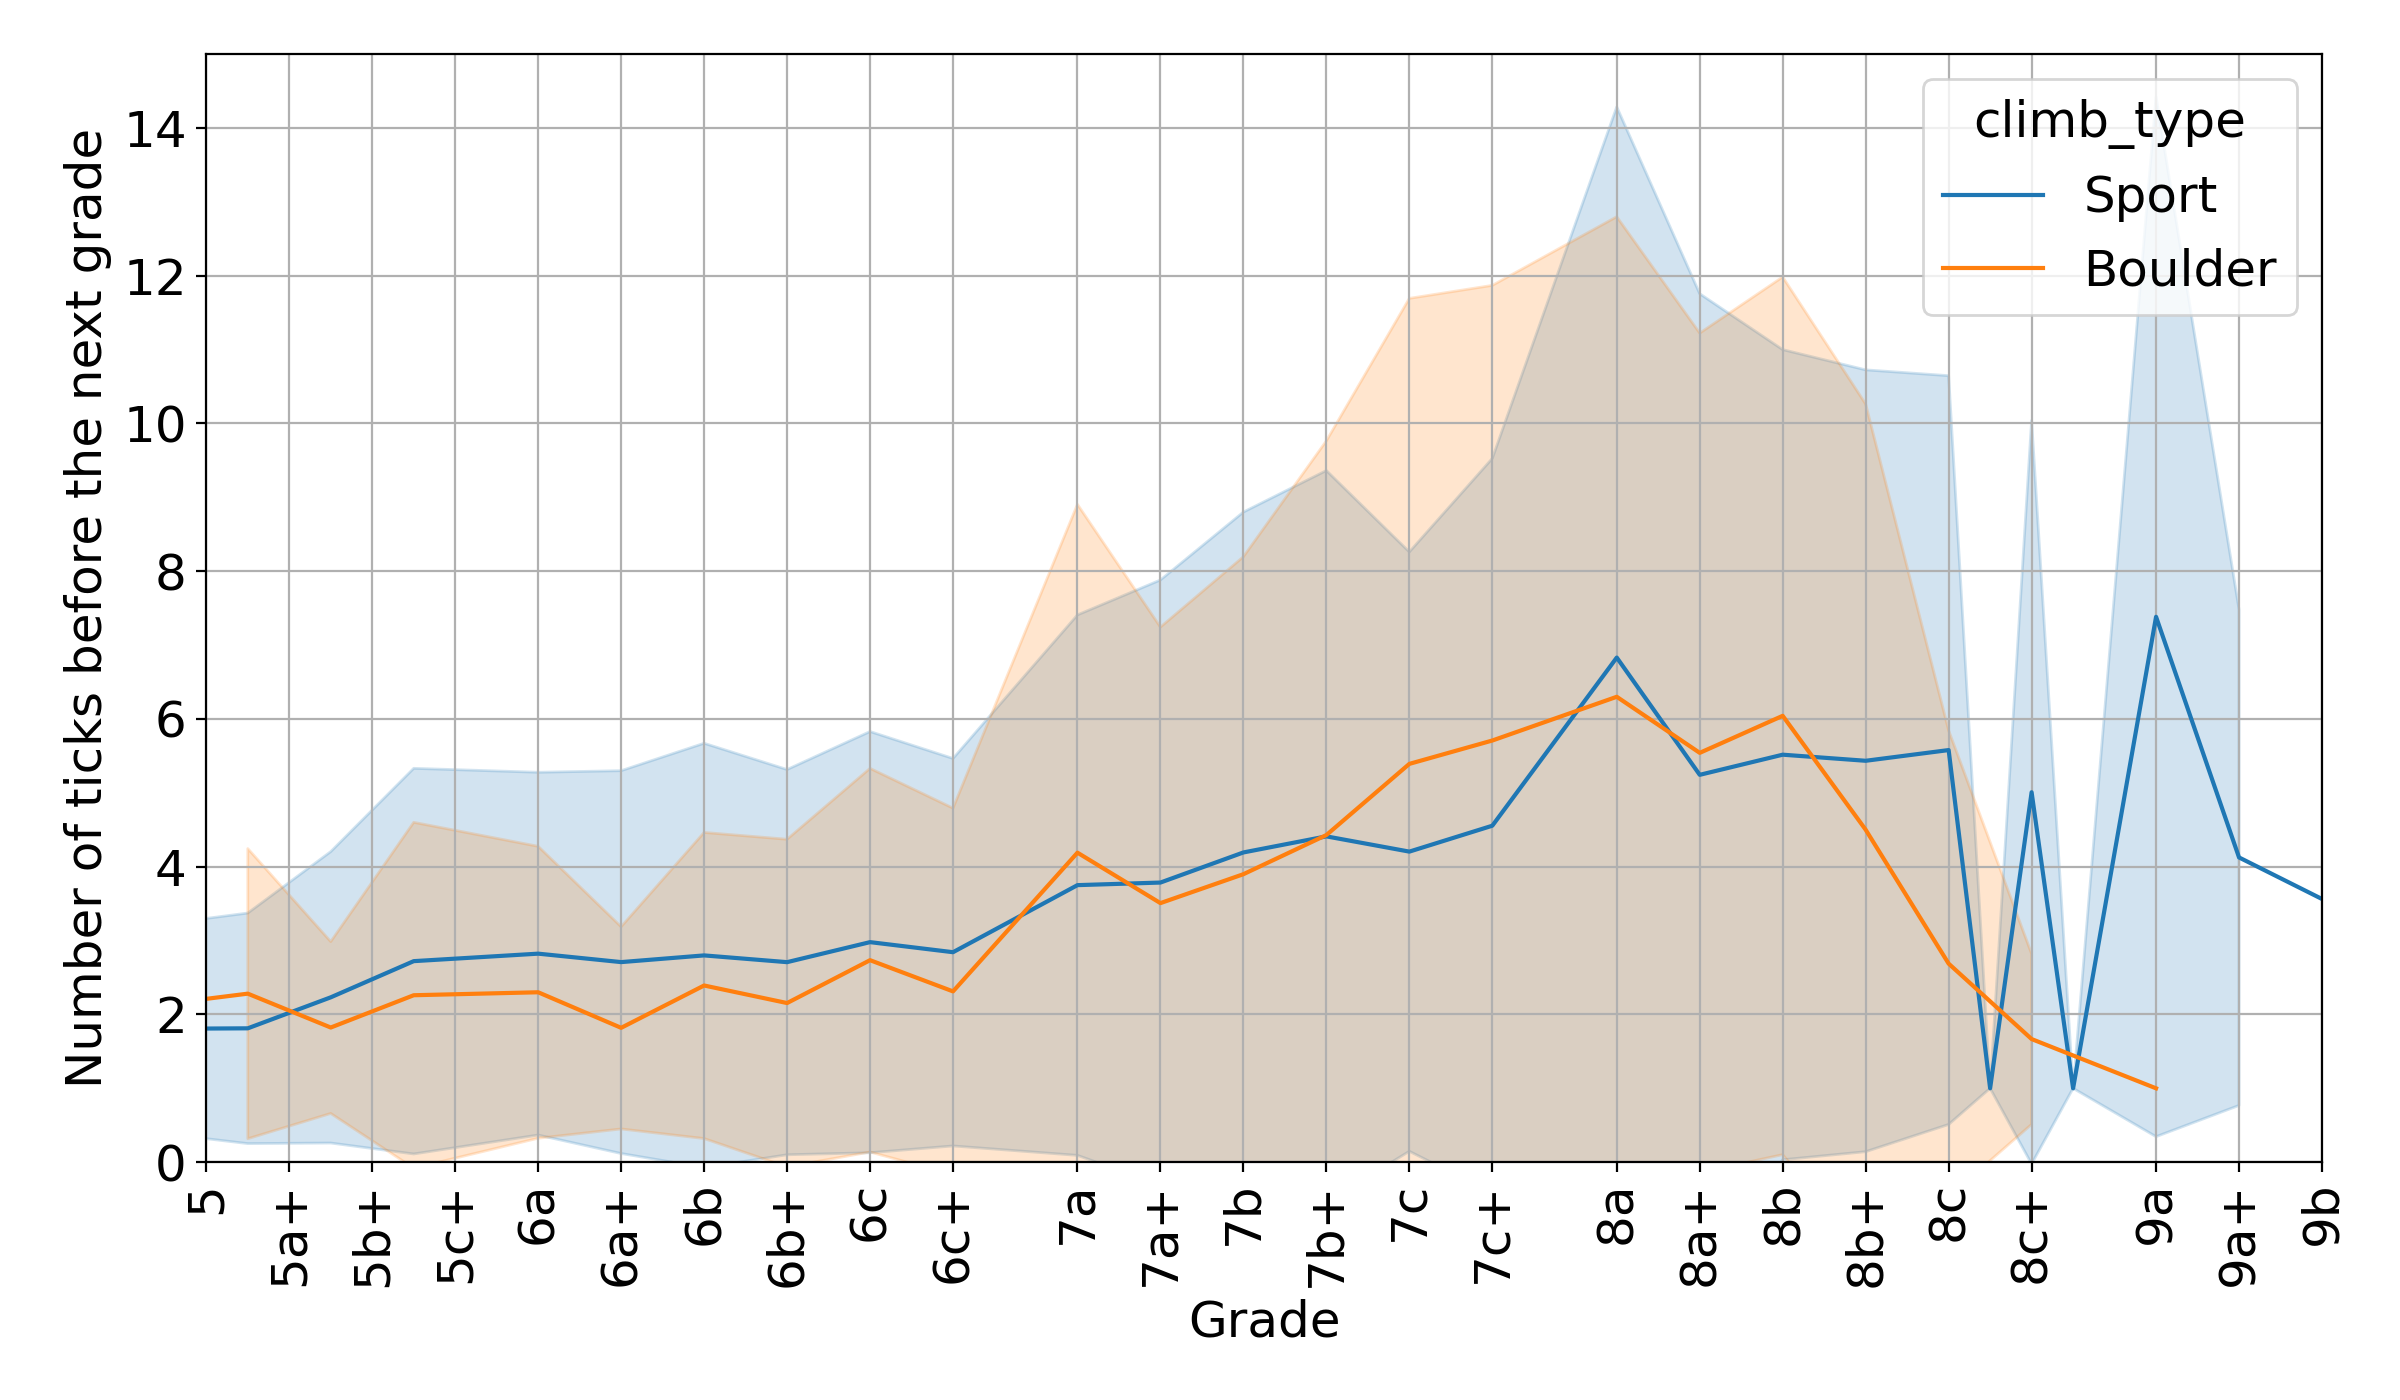
We spoke a lot about progression through grades in terms of time, but a different way to measure progression is through the number of individual ascents for a certain grade. The question I want to answer is: “How many routes are you expected to climb at your maximum grade before climbing the next grade?”. To answer this question, we’ll use a similar approach to “Max grade per user” mentioned before in this article. However, instead of selecting the maximum grade for each user, we select the second highest grade for each user and we count the number of occurrecies of that grade per user (thank you StackExchange). If we average the number of ascents or “ticks” for each grade, we obtain the following plot:
Figure 11c Average number of ascents for a certain grade before climbing the next grade
The figure shows a similar behaviour for sport climbing and bouldering. Say that your maximum sport grade is 7a and you want to know how many 7a to climb before being able to climb a 7a+. According to the plot, on average, the answer is 4. Keep in mind that this data was calculated based on climbers that do climb the next available grade. This means that climbers that did climb up to 7a+ climbed, on average, around 4 7a routes before climbing 7a+.
If you can climb between 2 and 6 routes of a certain grade you can expect to be able to climb the next grade.
Secondary analyses
Analysis of BMI
In addition to height, some of the users also have weight saved in
their profile, which allows us to calculate their BMI (weight
[kg]/height [m]2). If we plot the histogram of BMI for
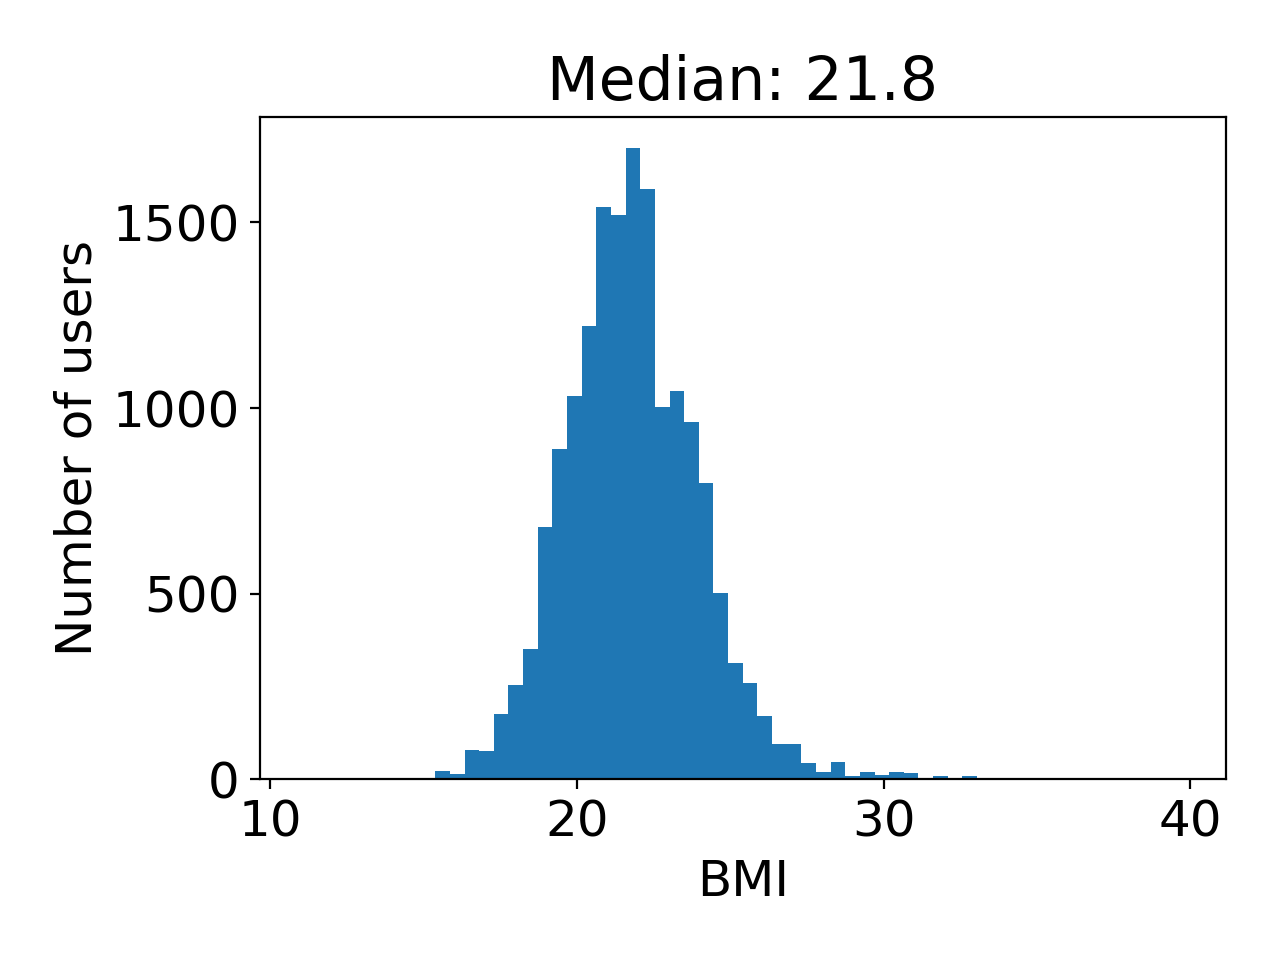
all the users, we can see that is almost normally distributed, with an
average BMI of 21.8 and standard deviation of 2.27.
Figure 12 Histogram BMI for all climbers in the dataset
A
healthy
range for BMI is between 18.5 and 24.9, so it’s good to see that the
majority of climbers are in a healthy range.
Using the same approach as the rest of this article, we can group users
by the maximum grade they’ve ever sent and plot them against their BMI.
Using this strategy, we can see if there is any correlation between BMI
and maximum redpoint grade.
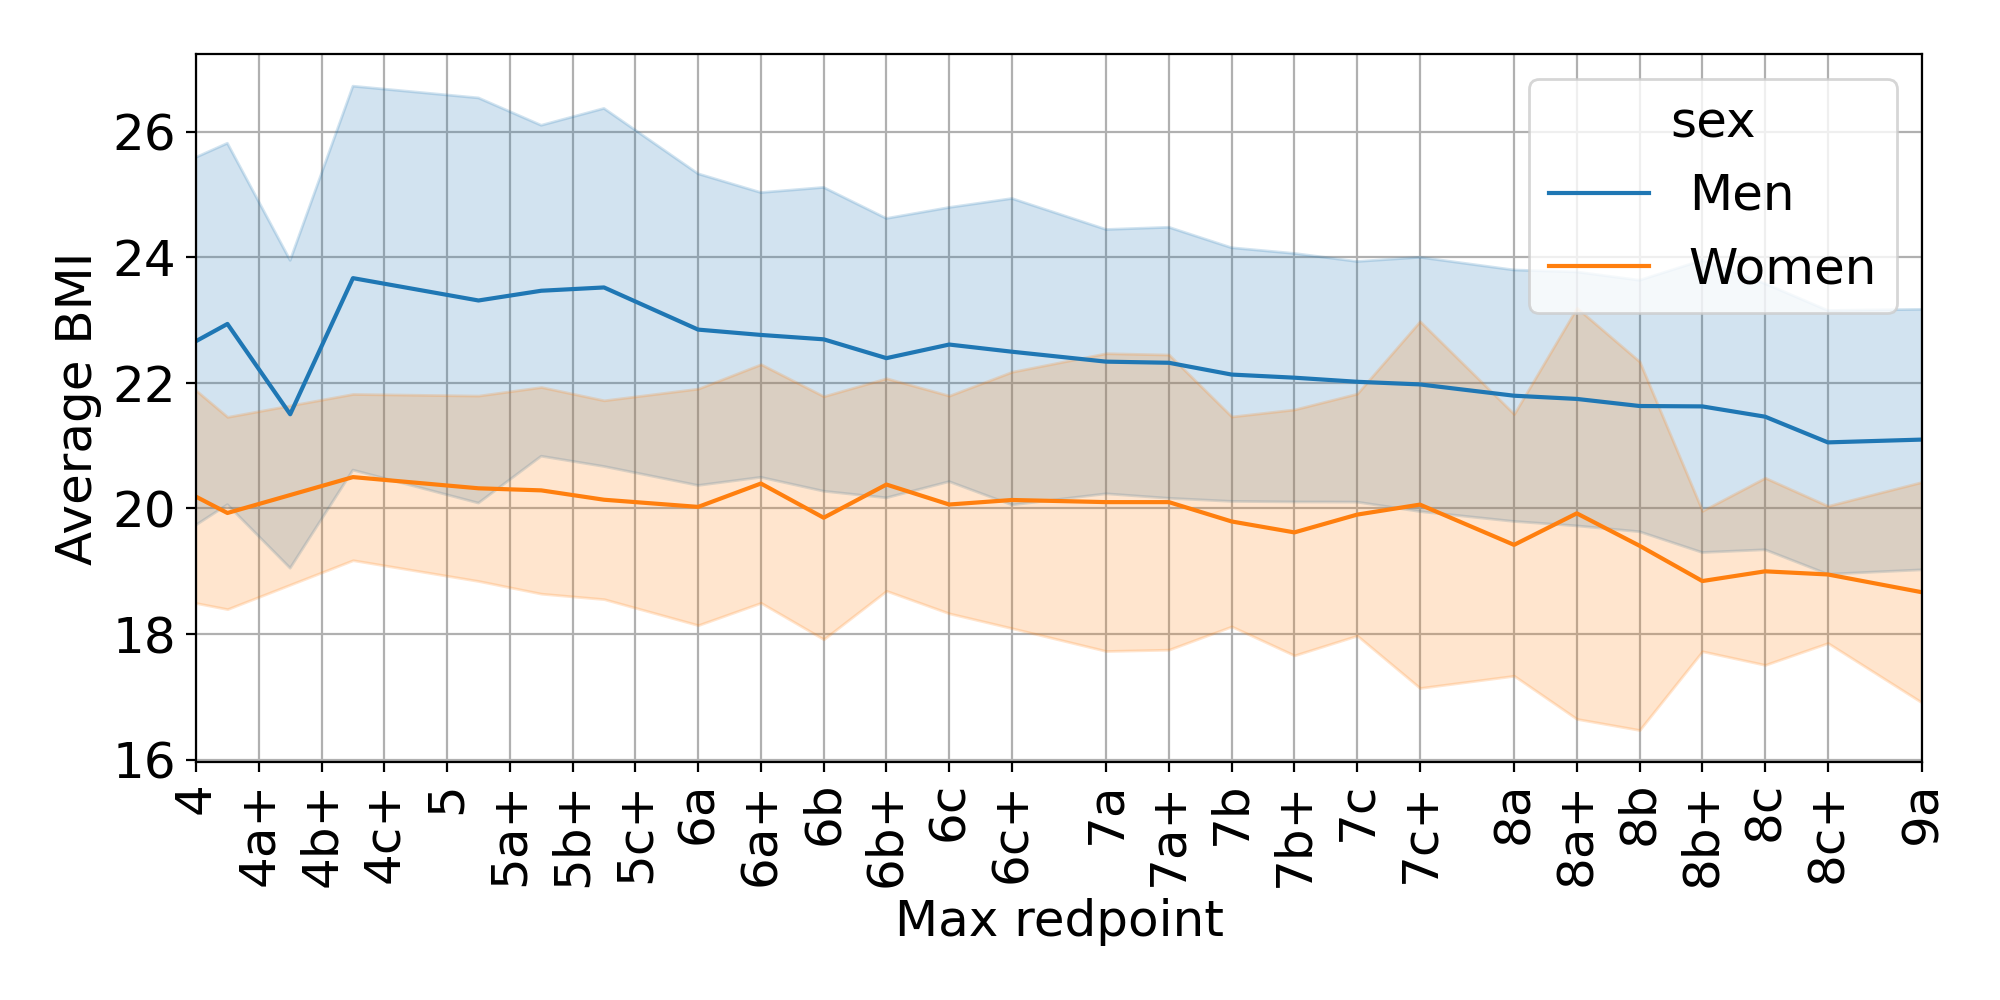
Figure 13 Average BMI for men and women vs maximum redpoint grade
From the plot, we can see that the average BMI correlates well with the
maximum redpoint, with the curve having a similar trend for men and
women. The correlation seems to be stronger for men (Pearson's r =
-0.190, p < 0.001) than for women (Pearson's r = -0.113, p < 0.001).
Since weight in climbing is quite a sensitive topic, I’d like to remind
the reader that these measurements are averages, with very large error
bars on top of them. This means that although the average climber has a
specific BMI, you can have pretty much any BMI within the healthy level
and still climb pretty much any grade.
Countries
Using the “country” entry from the dataset, we can select the max grade
ever climbed by each user and cluster them by nationality. This will
allow us to tell which country climbs the hardest in the world! For
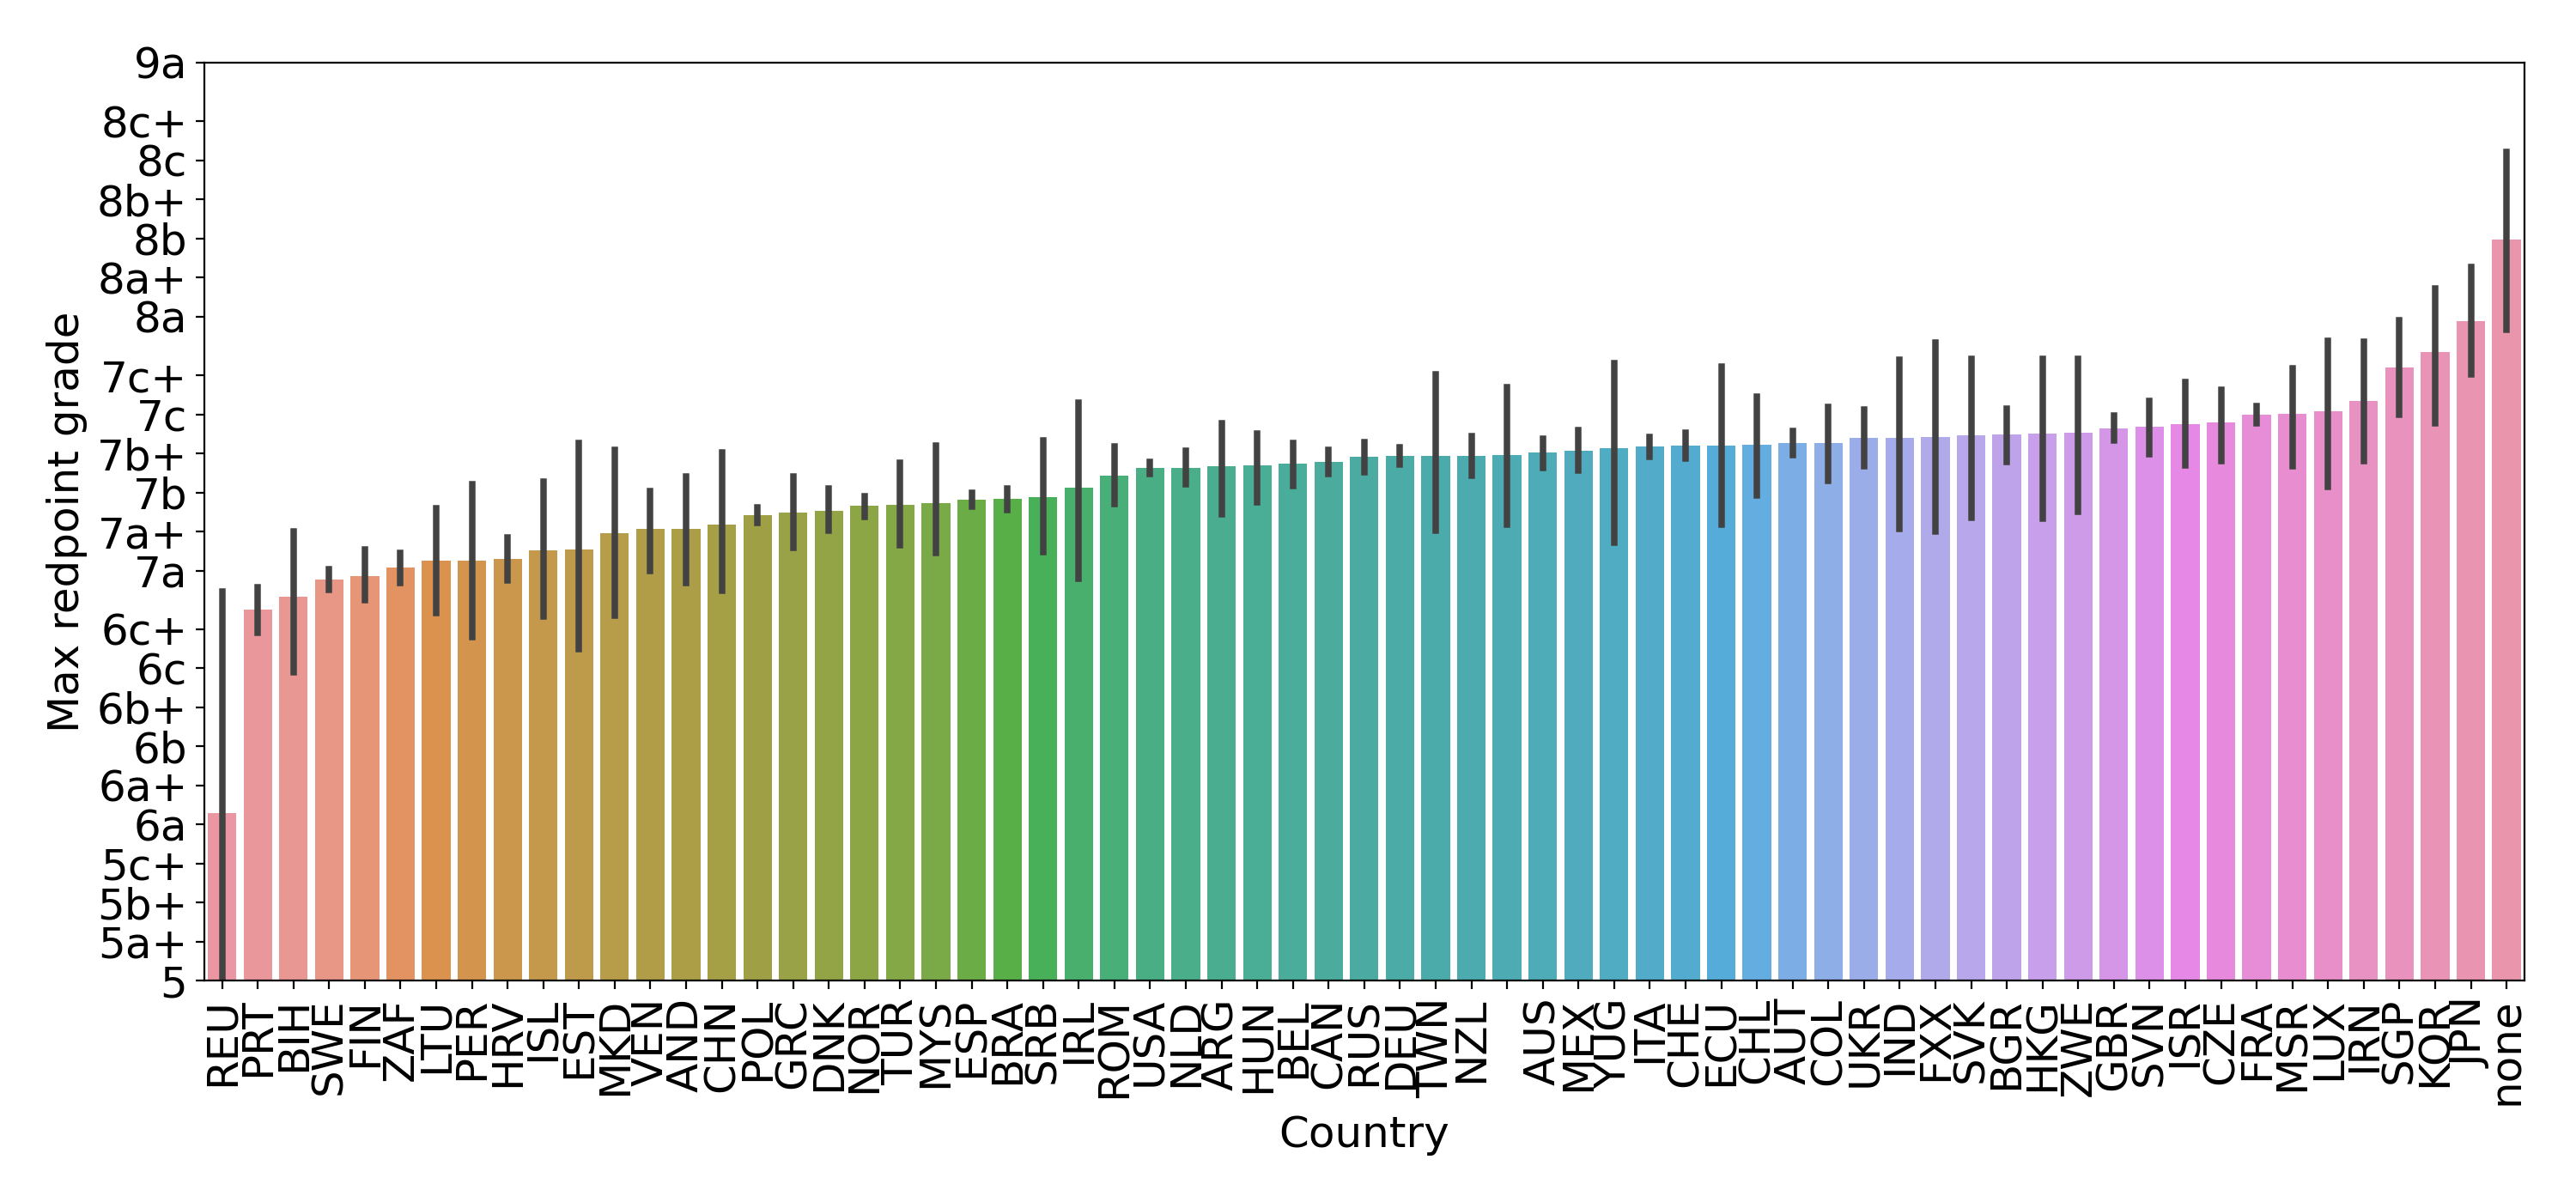
sport climbing:
Figure 14 Average maximum redpoint grade for sport climbing by country
the strongest sport climbers in the world are Japanese, followed by
Korean and Singaporean.
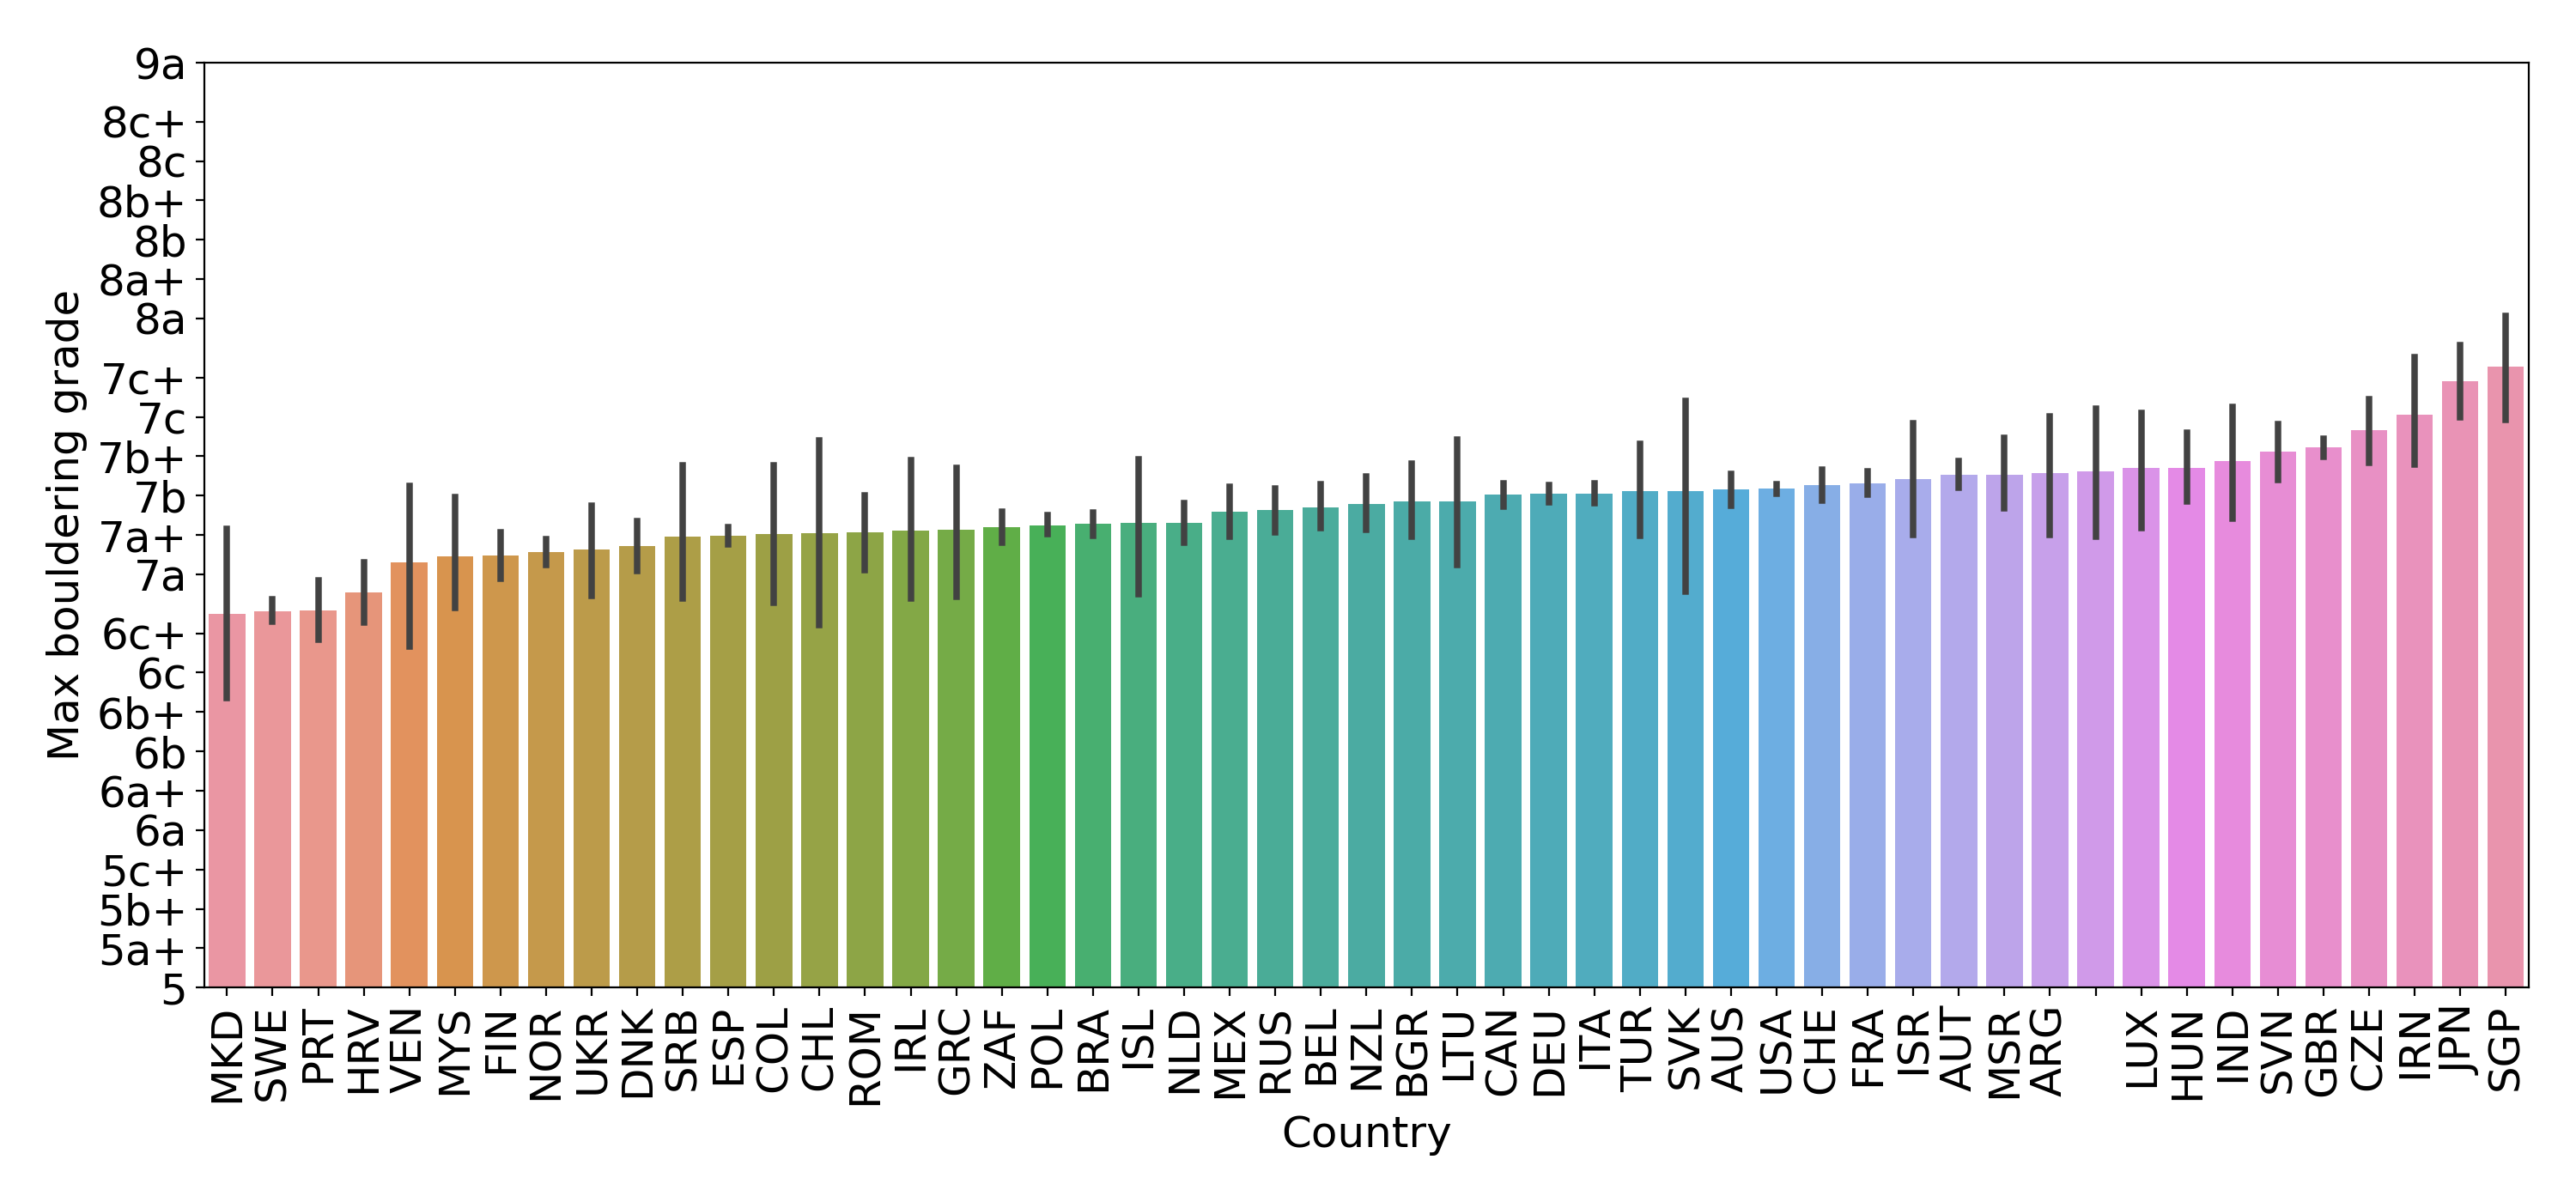
For bouldering:
Figure 15 Average maximum bouldering grade by country
the strongest boulderers are Singaporean, followed by Japanese and
Iranian.
Occupation
The last type of analysis that I decided to run on this dataset concerns
the occupation field that is available for each user. I selected all the
users that had a non-empty occupation field, counted the occurrences of
each and kept only those that appeared at least twice. I then generated a text document where each word was repeated the square root
of their occurrence, separated by a comma. I fed this document into a
word cloud generator and
obtained the following picture:
Figure 16 Word cloud generated with occupation field from the dataset
Some of the elements are actually the same occupation with different words or in
a different language, like “students”, “estudente”, “university
students” or “grad students”. There are also a ton of engineering
positions who, if they’re like me, they probably just love logging and
data…
Limitations
To conclude, I want to talk about some of the limitations of this article. (1) Beginners don’t really log their
ascents. When you get into climbing, logging ascents is not really one
of your priorities. As you improve and get stronger, you start having an
interest in metrics and progression, which is when you probably start
logging. This means that lower grades and not very well represented in
this analysis. On top of that (2) strong climbers often don’t bother
logging lower grades. I know this because most of my friends are like
that, they only log ascents that they think are “log worthy” and this
only exacerbates this limitation. (3) Some people logged only one or two
ascents in the entire dataset. (4) Climbers often take breaks, and these
are not recorded in the dataset. These long breaks can be very long and add noise to the variable “Time required to climb a grade”. (5) All the ascents logged in this dataset refer to outdoor climbing only.
I would also like to stress that this article is very different from a
normal scientific article that I would usually work on. Typically, I would do a literature review, work with a team, discuss research strategies and double check results with
other experts in the field. This article, since I wrote it in my free time, is mostly just a personal project that I decided to run in my free time. There could
be mistakes in the way I interpreted the data, or errors in the way I
processed it and bugs in the code. If enough people think it’s interesting and I have the time, I might turn this into an actual publication at some point. If you’re interested and you would like to collaborate on this, or also to share some feedback, please get in touch.
Appendix
A1 - Table of grades
The following is a table version of the plot depicted in Figure 2. The first column is the grade you want to climb, the second column is the maximum flash/OS grade you need to send and the third column is the grade you should be able to flash/OS consistently.
Max Redpoint
Max Flash/OS
Average Flash/OS
6a
6a
5b+
6a+
6a+
5c
6b
6a+/6b
5c+
6b+
6b
6a
6c
6b/+
6a
6c+
6b+/6c
6a/+
7a
6c
6a+/6b
7a+
6c+
6b
7b
6c+/7a
6b/+
7b+
7a/+
6b+/6c
7c
7a+
6c
7c+
7b
6c/+
8a
7b/+
6c+/7a
8a+
7b+/7c
7a
8b
7c/+
7a+
8b+
7c+/8a
7a+/7b
8c
8a
7b/+
8c+
8a+
7b+/7c
9a
8a+/8b
7c/+
9a+
8b+
7c+/8a
A2 - Historical progression
In this article, to calculate the grade progression I considered the maximum grade that each user has sent, together with the time it took them to climb that grade. This produces one single datapoint per user. However, for each user, I can extract much more data than that. I know when they climbed their first 6a, their first 6b and so on, so that each user becomes as many datapoints as the grades they’ve sent.
Here is the strategy: for each user in the dataset, I have all the grades they’ve ever climbed with a date of when they sent each one. If I group the data in combinations of
(user, grade), I can pick the minimum date (i.e. the first time) a user
sent that specific grade. For example, (Adam, 6a, 2006), (Adam, 6a,
1999), (Adam, 6a, 2009) becomes (Adam, 6a, 2006). Knowing the year that
each user started climbing, I can easily calculate how long it took each
user to climb a specific grade, and averaging through the grades will produce the
average number of years required to climb each grade.
In theory, this approach makes sense. In practice, it doesn’t. The problem is that not every user
climbs every grade in a progressive fashion. Think of the first time you
climbed your first 5 and the first time you climbed your first 3. Chances
are, you climbed the first 5 in less than a year and your first 3 many
years later (simply because you didn’t come across one!). Another issue
is that strong climbers don’t really bother logging (climbing?) lower
grades, introducing additional noise in this measurement. For these
reasons, the progression plot produced with this method was very noisy
and unreliable for grades below 7a, so I decided to keep it out of this
analysis. If you still want to see it, you can find it in this repo (that I publish at some point).
A3 - Progression of men vs women
In the main article, we showed the average progression of men and women
is different over the years. When we process those plots, we need to
average the data in one dimension, either the grade (clustering years)
or the years (clustering grades). This process necessarily reduces the
amount of information presented by the plot and can create some
misconceptions. A better approach to visualise the data, which is far
more complicated to read, is to look at the 2D histogram of grades/years
for both men and women. The 2d histogram considers all the pairs
(grade, years climbing) and counts how many occurrences are in the data
for each pair. We can do this both for men:
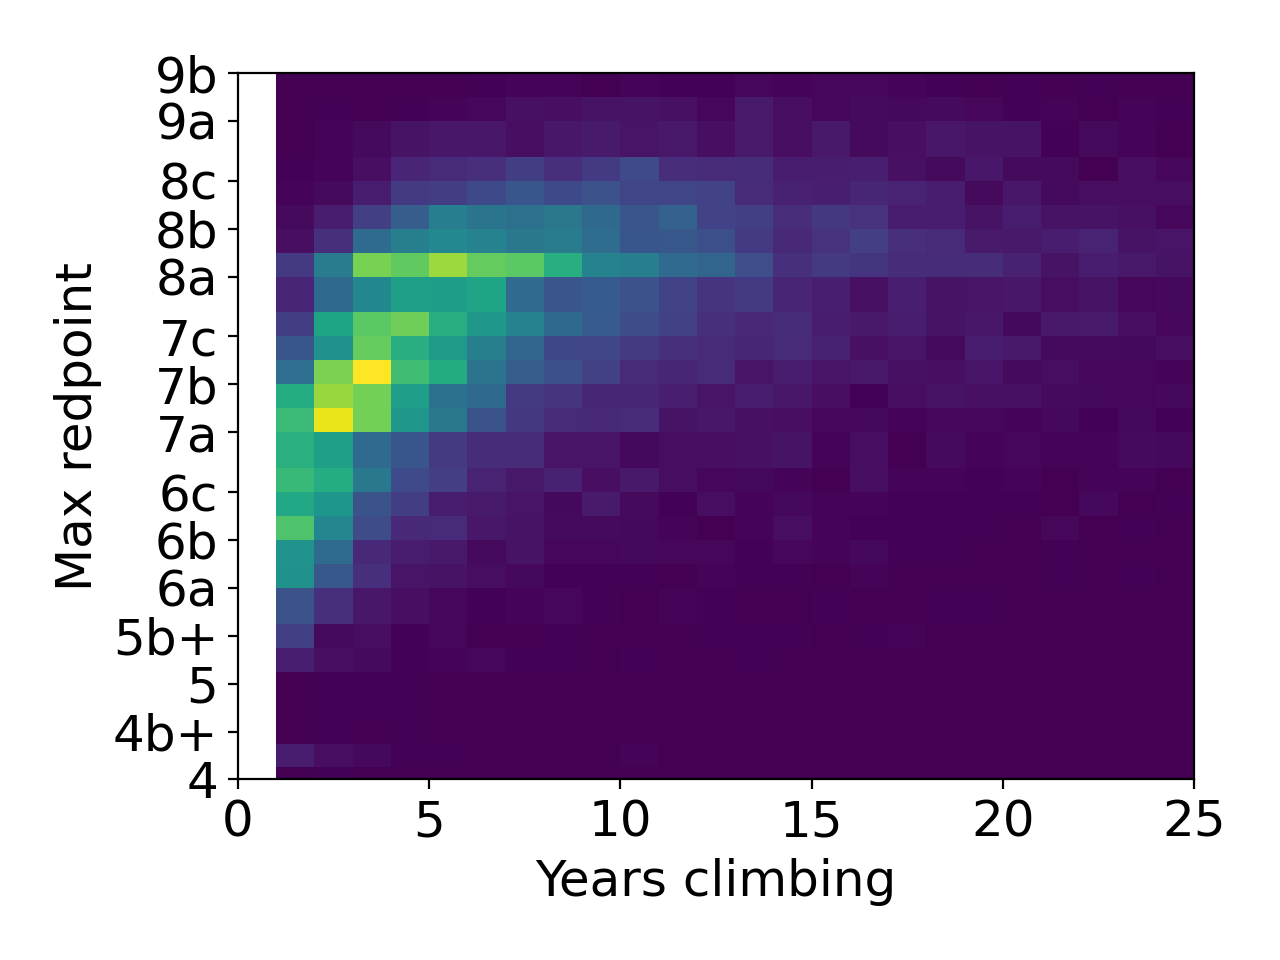
Figure 17 2D histogram of maximum grade vs years climbing for men
And women:
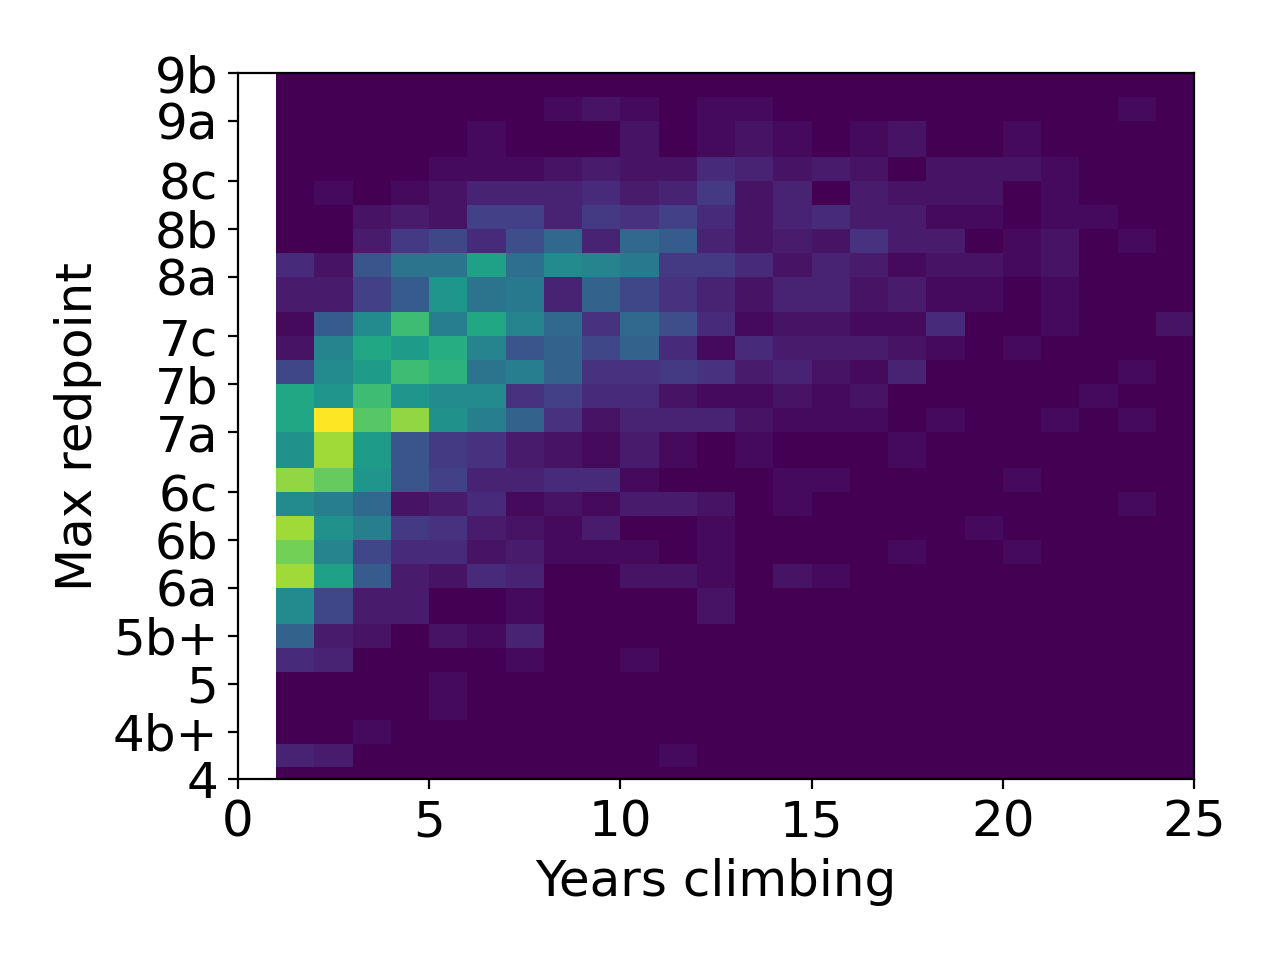
Figure 18 2D histogram of maximum grade vs years climbing for women
Both images are normalised so that the yellow colour is the most number
of occurrences, while blue is the least. To get a better idea of the
comparison between men and women, we can plot the two images next to
each other, men on the left (flipped left to right for clarity), and women
on the right.
Figure 19 Combination of Figure 18 and 19 with contour lines
To plot this image, I first applied a gamma (0.3) correction to the
distribution and then calculated the contour lines, or iso-occurrence
lines, to highlight similarities between men and women. From this plot,
we can see that the finding from the main section on the comparison
between men and women make perfect sense. If we choose a value on the
x-axis, for example 5 years, we can see that there are more men that
climb harder grades in the 8a range than women, as confirmed by the
orange contour line that goes higher for men than for women. This is in
agreement with the results of the main section where we showed that the
average male climber climbs harder than the average women climber who
has been climbing for the same number of years.
The plot from the main section, however, also showed that for a specific
grade (say 6b), the average women climber requires slightly less (2.5
years) than the average man (3 years) to achieve the same grade. Why is
that? The answer lies in the variance of “years climbing” for the ascents logged
between men and women in this dataset. If you look at the figure above,
the blue contour line has a much wider span horizontally for men than it does for
women, meaning that men have started climbing in a much more scattered
time frame than women have. In other words, the majority of women have
started climbing in the last 20 years, whereas the majority of men have
been climbing for more than 40 years. This higher variability of years
climbing unconditionally skews the distribution of years, increasing the average,
creating this difference between men and women.
]]>Alessandro MasulloMy experience converting a van2020-10-08T01:00:00+01:002020-10-08T01:00:00+01:00http://www.alessandromasullo.com/blog/my-experience-converting-a-vanThis article is not going to be a guide on how to convert your own van. It is mostly a collection of notes and information that I put together during the process of buying and converting my own van. I will explain how I decided on a vehicle, designed my own conversion kit, and built it using simple tools and no workshop available.
I hope this can help other people to join Vanlife too!
The research
The first and most important part of this project was figuring out what my requirements were and therefore what kind of vehicle I was looking for. Vans can go from as tiny as a Fiat Fiorino, all the way up to ex-school buses converted into flats on wheels. Normally, bigger vans are more suitable for people that are planning on living in them all the time, whereas I was looking for something more suitable for weekends off, up to maybe a fortnight. Most of the vans on the market also come with 2/3 seats max, while I liked the idea of being able to use it as a normal 5-seater car. Parking was also an issue for me, and I wasn’t looking forward to re-learning how to drive a massive vehicle around the narrow single-lane streets of Bristol. Vans are also typically more expensive to insure and tax, and if I could save on that it would surely be better. To summarise my requirements:
Can be used as replacement for a car
At least 4-5 seats
Easy to drive and park
Reasonable fuel consumption
Easy to insure/tax
Be as stealthy as possible
So, after some vandering around Reddit, I found out about a category of vehicles called MPVs, or Multi-Purpose Vehicle (more like Many-People, if you ask me…). MPVs are cars that are created to maximise the interior space and often have even more than 5 seats. They might look as big as SUVs, but since they’re not designed to drive off-road, they have less ground clearance and therefore more space inside. Some examples of MPVs are Ford S-Max or Ford Galaxy, Citroen Berlingo, Volkswagen Sharan, Fiat Doblo…
Conversion style
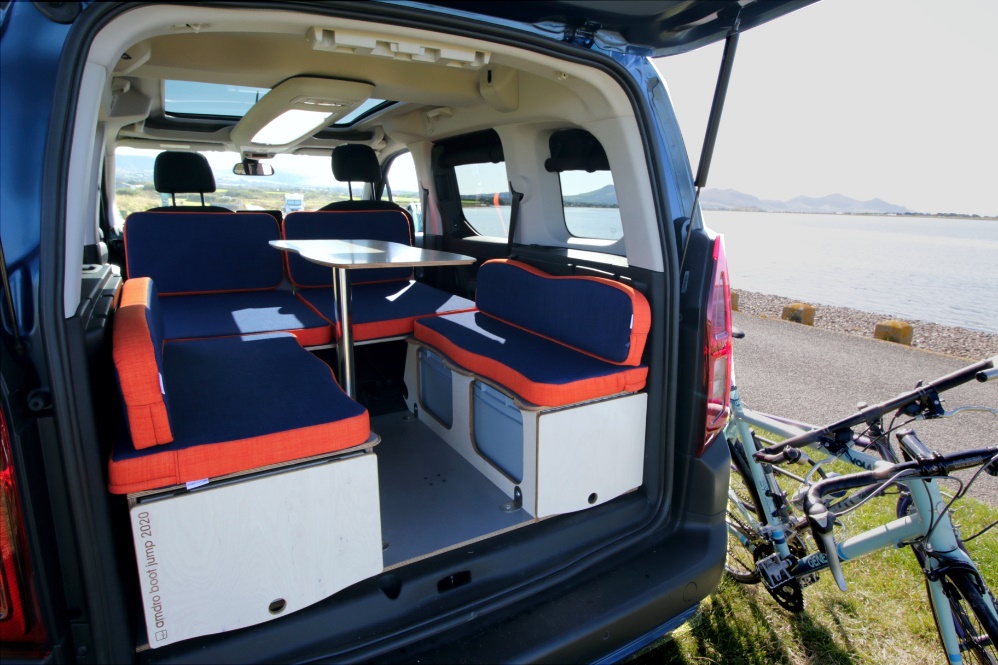
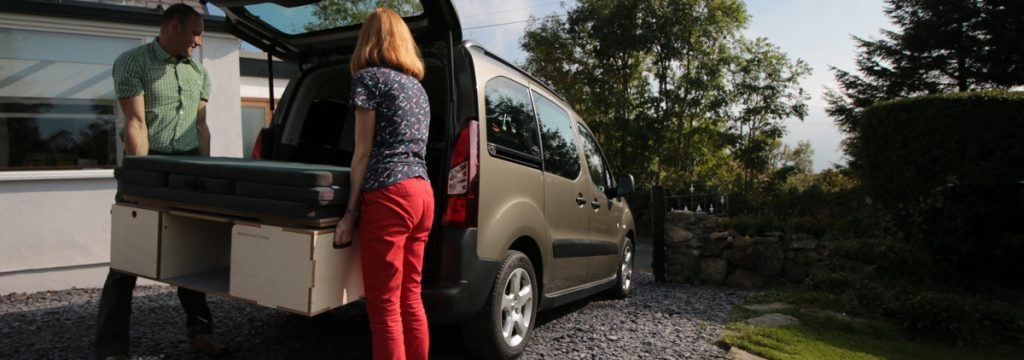
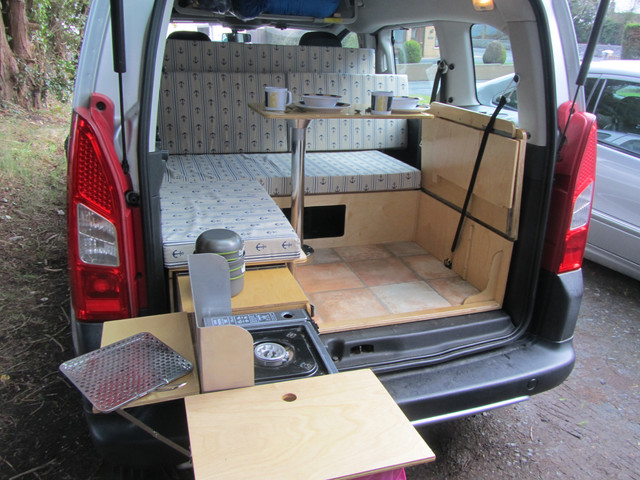
MPVs seemed like the best compromise between a car and a van, but how do you convert one without losing the seats? After some research, I ended up on the alternative campervans website of Amdro, which produces the so called “boot jump”. The boot jump is a compact and smartly designed structure that fits in the boot of your car. When you need it, you simply lower the seat back of the rear seats, and the boot jump unpacks into bed, table, lounge and kitchen while simply sitting in the back of your car when you don’t need it. If you need to use the boot, you can simply slide the structure out of the car and restore its normal functionality.
I thoroughly fell in love with the design and decided that this was going to be the base for my conversion, but there was one problem that I had to face… It’s expensive. Like really expensive. The standard model sells for a bit less than £2000! Plus, where’s the fun in buying something already made? After a simple Google search of “diy boot jump” I realised there were tons of different interesting design ideas and I only had to pick one and build it. Great!
Pros:
Cheap and easy to build
Completely removable
Does not require any permanent modification to the car
Kitchen drawer can be accessed without opening the entire structure
Can be used while carrying up to 5 passengers
Cons:
It takes 3-5 minutes to set up open
You need to open the boot to open the kitchen drawer (not ideal in rain or cold)
Not really practical to open just for a very quick nap
It (usually) requires you to move both front seats forward and lower the back
Space occupied by car’s rear benches is lost when the conversion is used
Choosing the right MPV
After deciding I was going to get an MPV and convert it using a boot jump, I started looking into specific vehicles that would be compatible with boot jumps. Although the concept can be applied pretty much to any car (Honda Jazz, Volvo), my main requirement was the ability to sit upright at the table, so that I could do some work from remote if I had to. A very useful resource that I used a lot during my research was RiDC (Research Institute for Disabled Consumers). Their search tool allows you to check every possible measurement inside a car and allowed me to easily discard some MPVs that were not compatible with my height requirements.
A good starting point for my research of the perfect vehicle was the list of cars supported by Amdro, which includes: Citroen Berlingo (or Peugeot Rifter, or Partner Tepee, they’re all the same car…), Renault Kangoo, Volkswagen Transporter, Volkswagen Caddy, Ford Tourneo and Fiat Doblo. After checking availability on the second-hand market for these cars, and especially the price, I realised that the most likely candidates for me were the Citroen Berlingo and the Fiat Doblo, both vehicles for which there’s a ton of DIY conversion tutorials on the internet.
WAV
As soon as I started digging deep into the second-hand market for Berlingos and Doblos, I realised that the majority of these vehicles sold are converted as WAVs, or Wheelchair Accessible Vehicles. There’s no standard conversion around, but the average meaning of WAV is that the vehicle is heavily modified to have a ramp (manual or electric), which is often permanently welded onto the chassis. The car is also lower on the ground, the fuel tank is replaced with a smaller one to allow for higher ceiling room and the back seats are either removed completely or replaced with smaller ones on the sides. The problem with WAVs is that they’re not easily compatible with the boot jump: the whole point of the boot jump is that you simply lower the back of the rear seats, open the bed and you’re good to go. Since every WAV is different, I would have had to come up with a heavily customised solution. WAVs are probably fine if you’re planning on doing a permanent conversion, but the amount of work involved didn’t really appeal to me, so I excluded this possibility.
Another really annoying fact is that they’re not really properly classified on Autotrader, which means that you manually need to inspect the pictures to discard them. An easy way to recognise them is to look at the rear bumper: if it’s got vertical inserts, that’s the bit where the ramp comes down and it’s going to be a WAV. The only main advantage I could find of buying a WAV compared to a normal car is that they normally come with ridiculously low milage while selling at the same price as the normal ones.
Price vs age vs mileage
The next step towards buying a van was deciding on a range of mileage, age, and price that I was willing to accept. Since I had very little experience buying cars, I started doing what I feel the most comfortable with: plots.
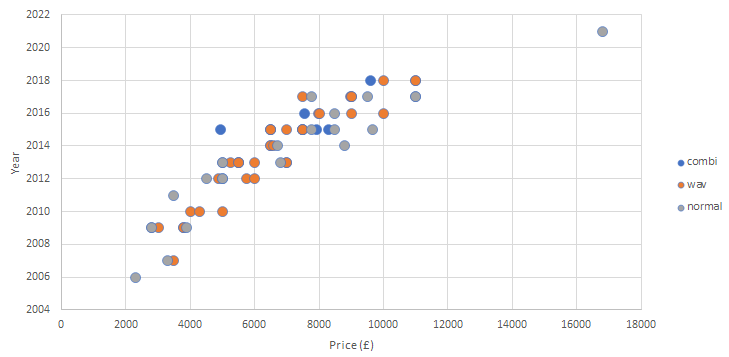
I looked at all the cars on sale (Fiat Doblo) and plotted them by year and price. Although mileage does have an impact on price, the main influencing factor for the price was age. From this plot, I could see that the price increases almost quadratically with the year. Looking at the data, I decided to buy something in the range of 2012-2013, which meant a budget of £4k to £6k.
With these parameters in mind, I managed to reduce my search space drastically, which made my life a lot easier. I was looking for a 2012-2013 Fiat Doblo or Citroen Berlingo between £4k and £6k with reasonable mileage and in good conditions, so I set up an alert on Autotrader and started waiting. After checking in person a few Doblos and Berlingos, I realised that the Doblo was slightly bigger and taller, so I decided to narrow down my search to the Fiat car.
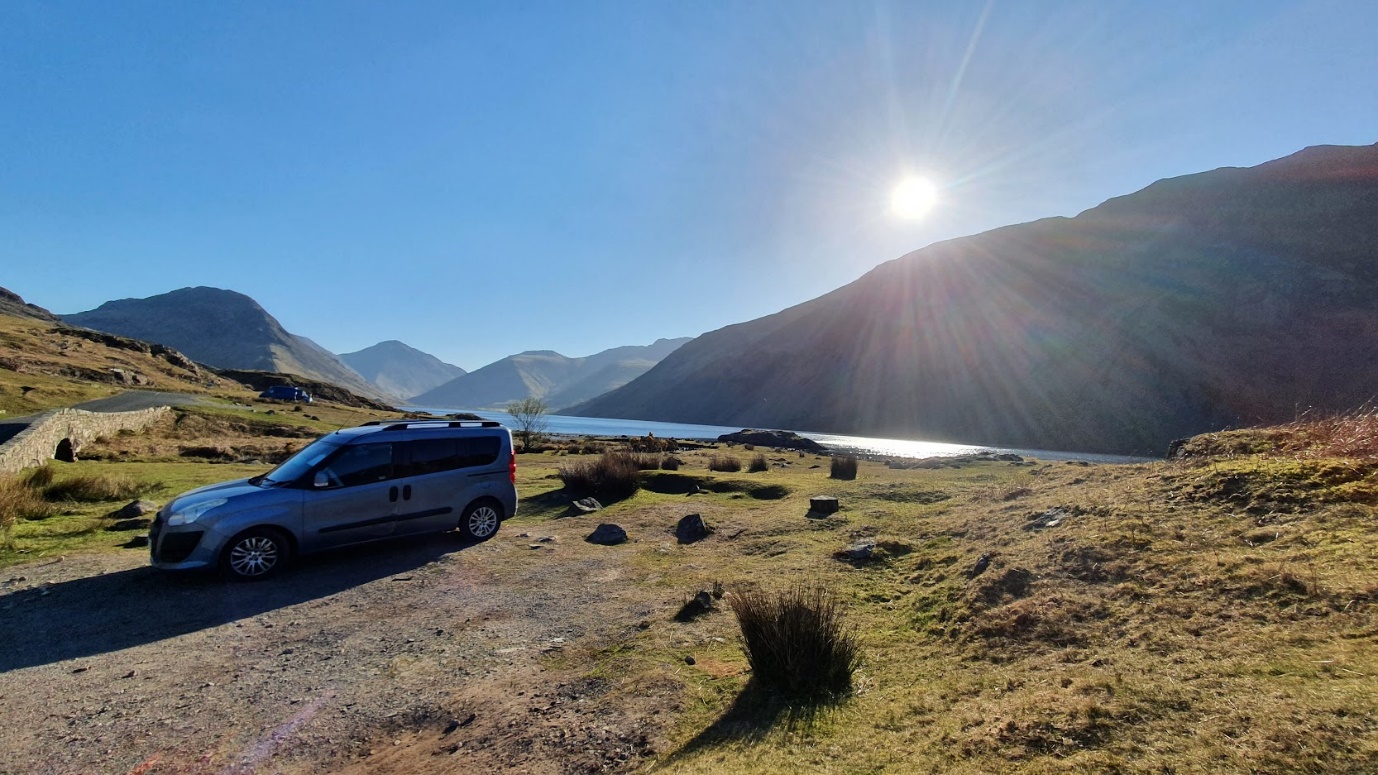
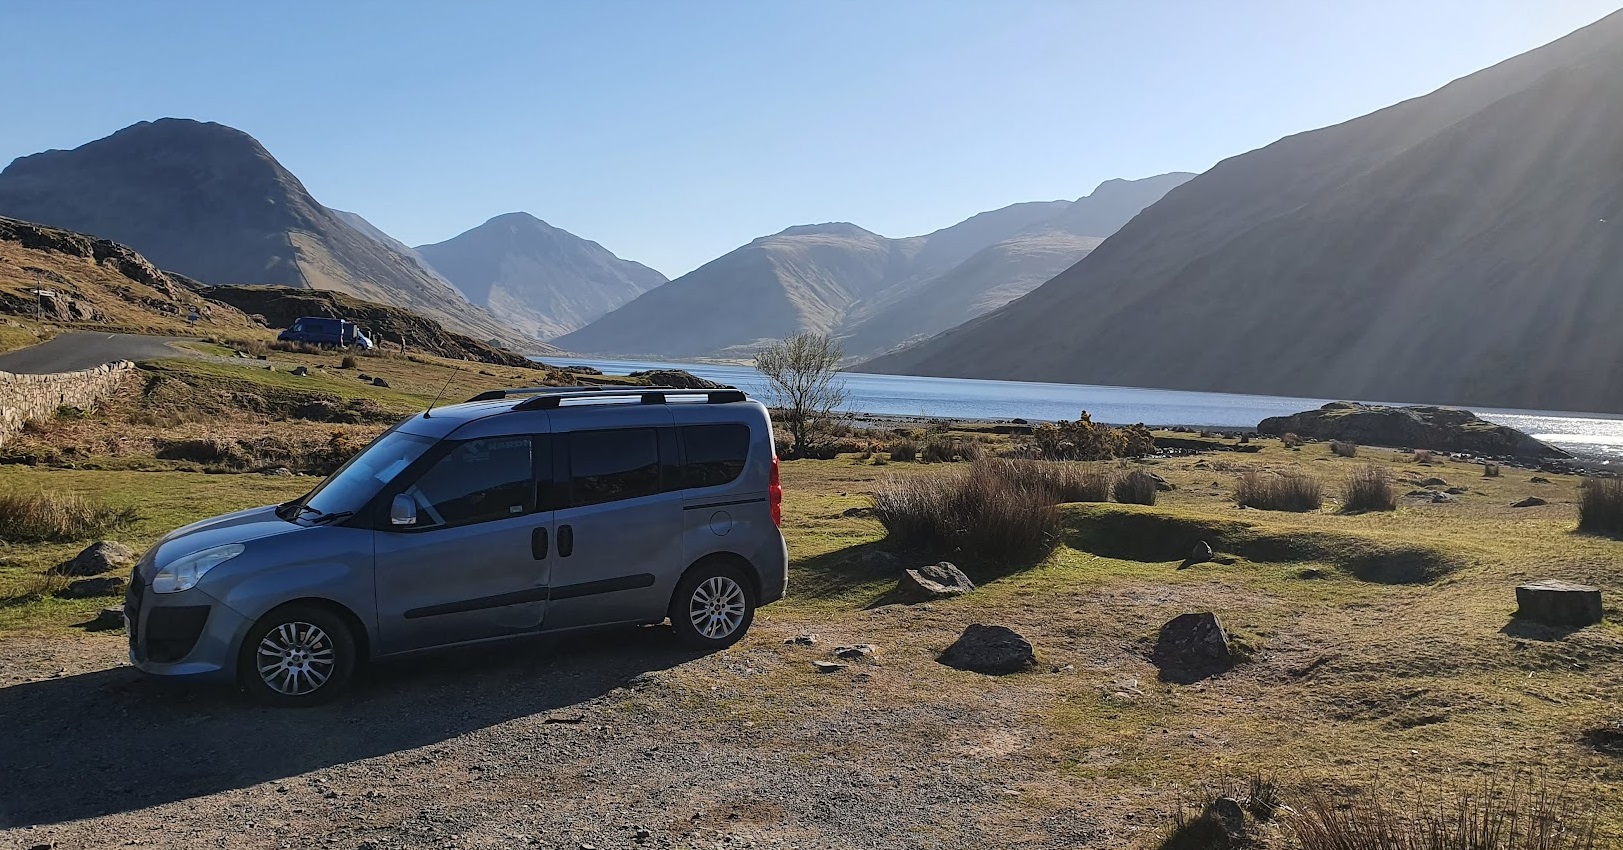
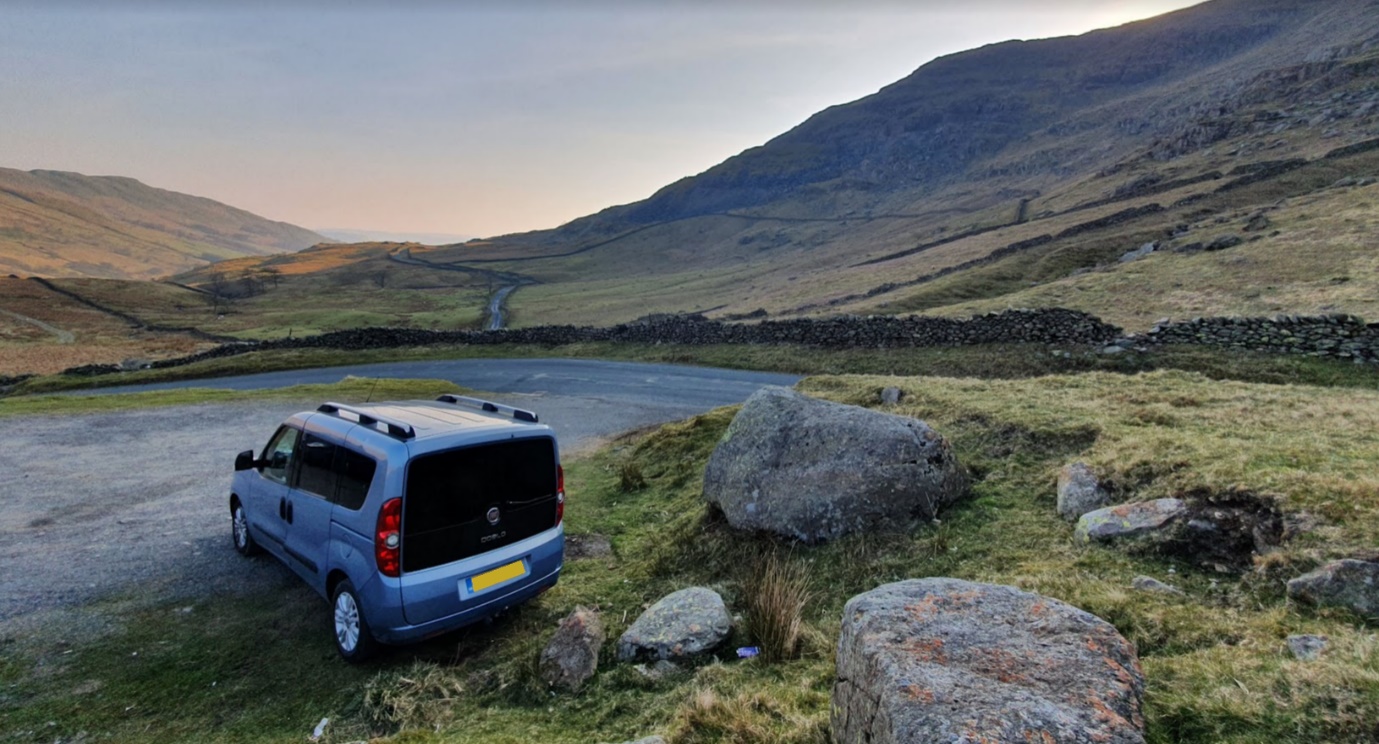
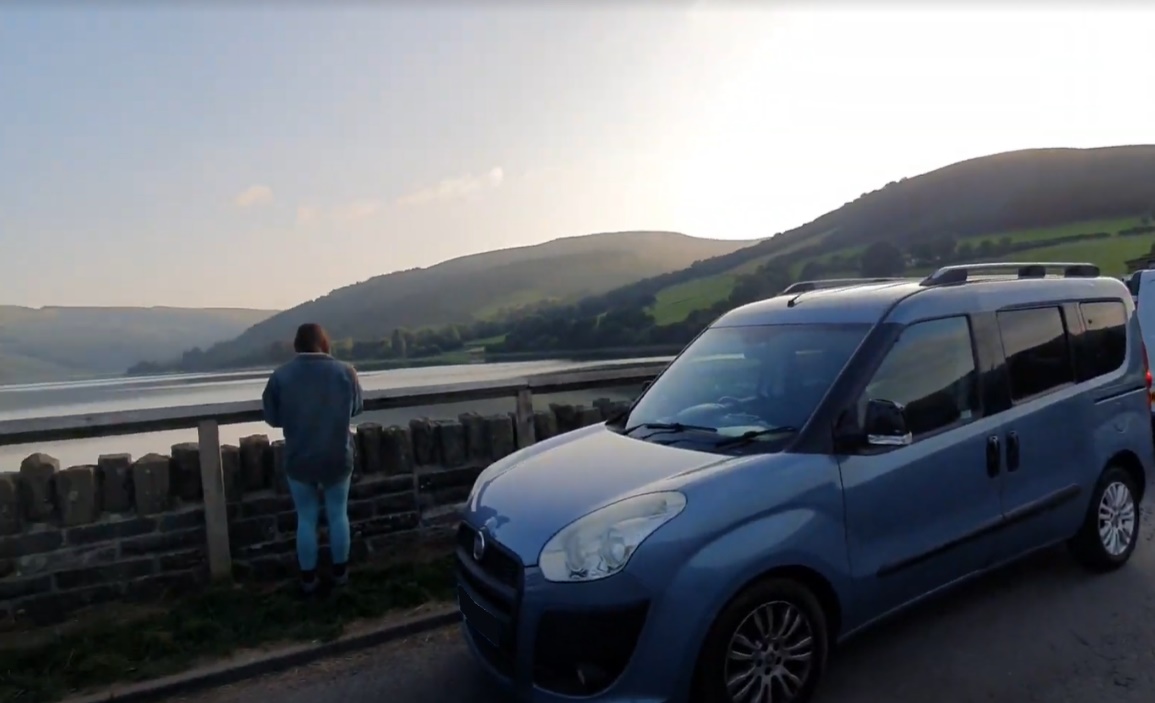
After 2 months since when I started my research, here she came:
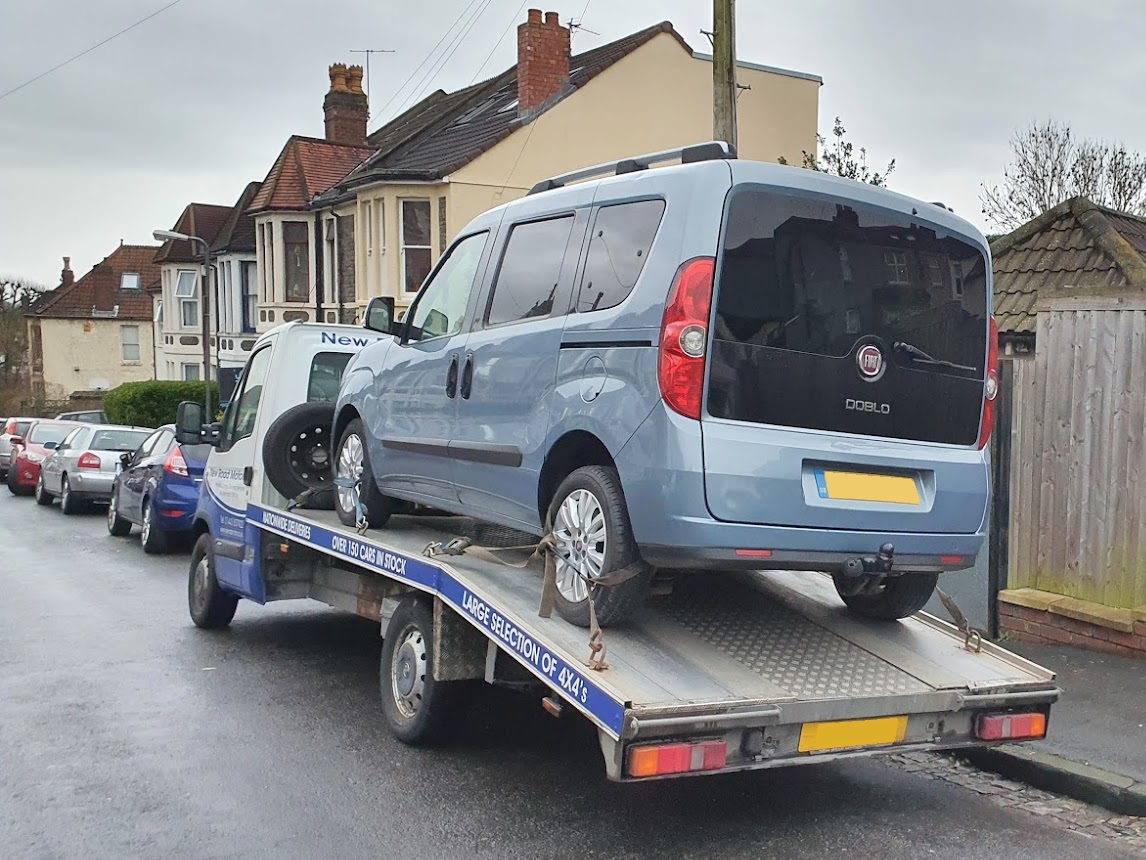
Because of COVID-19 regulations, I couldn’t see the car before buying it and it was delivered directly to my address. Luckily, the dealer kept their promise and the car was in as good condition as they mentioned.
The conversion
Now that I had a car, it was time to start the conversion. How do I build a boot jump without any tool, workshop space and practical skills working with wood? I didn’t plan to build something up to the commercial standards of Amdro, but I didn’t want to bodge it either. The first problem was buying and cutting the wood to size. What most people normally do for their conversion is buying a proper electric saw, buy a few large sheets of ply and cut the wood to size by checking the measurements as they go. Since I didn’t have space for a big saw, nor experience cutting wood in a straight line, I decided to ask a woodshop here in Bristol to cut it for me. For just £20 extra on top of the price of the wood, they would cut all the pieces that I wanted, the sizes that I wanted.
The main problem with following this approach is that I needed to have a very precise design in mind, with all the right pieces and measurements written down to the millimetre, no room for mistakes! So I installed Fusion 360 which, to my surprise, is free, and started searching YouTube tutorials on “how to design furniture in Fusion 360”. One important thing that I did while creating my design was making it as parametric as possible. A parametric design allows you to create a flexible model that updates all its parts automatically when you change some measurements. By doing so, I could create my design without paying too much attention to the size of the car, and I could take precise measurements later on.
Design of a boot jump
Designing the boot jump was probably the longest part of this project. Although the main idea is very simple and clear from the pictures of the Amdro boot jump – a large box with two empty spaces and a drawer, with a top that “unwraps” as a bed – the devil is in the details, of course. What kind of plywood should I use? How thick should the ply be? Should I make the box entirely out of ply or just planks and blocks? How does the bed unwrap? How do the hinges interfere with the wood? How do I make the joints? Can I put screws through the plies? How do I make a drawer for the kitchen? How high should the seat be? Do I use glue or bolts? And so on, and so on. I didn’t even know exactly what I wanted, and the more design ideas I found on the internet, the more questions I had.
When I got close to drowning in the sea of information that is the internet, I found an interesting post on a forum for conversions of Citroen Berlingo. Gravity, a Welsh user of the forum, created their own boot jump for a Citroen Berlingo, documenting every single step of the process. Not only they created a very similar boot jump to the one produced by Amdro, but they also improved their design by introducing a foldable side of the box that increases floor space when sitting inside.
Armed with patience, the details from Gravity and a load of free time due to lockdown and the climbing gyms being closed, I started creating my own design in Fusion 360.
The final design
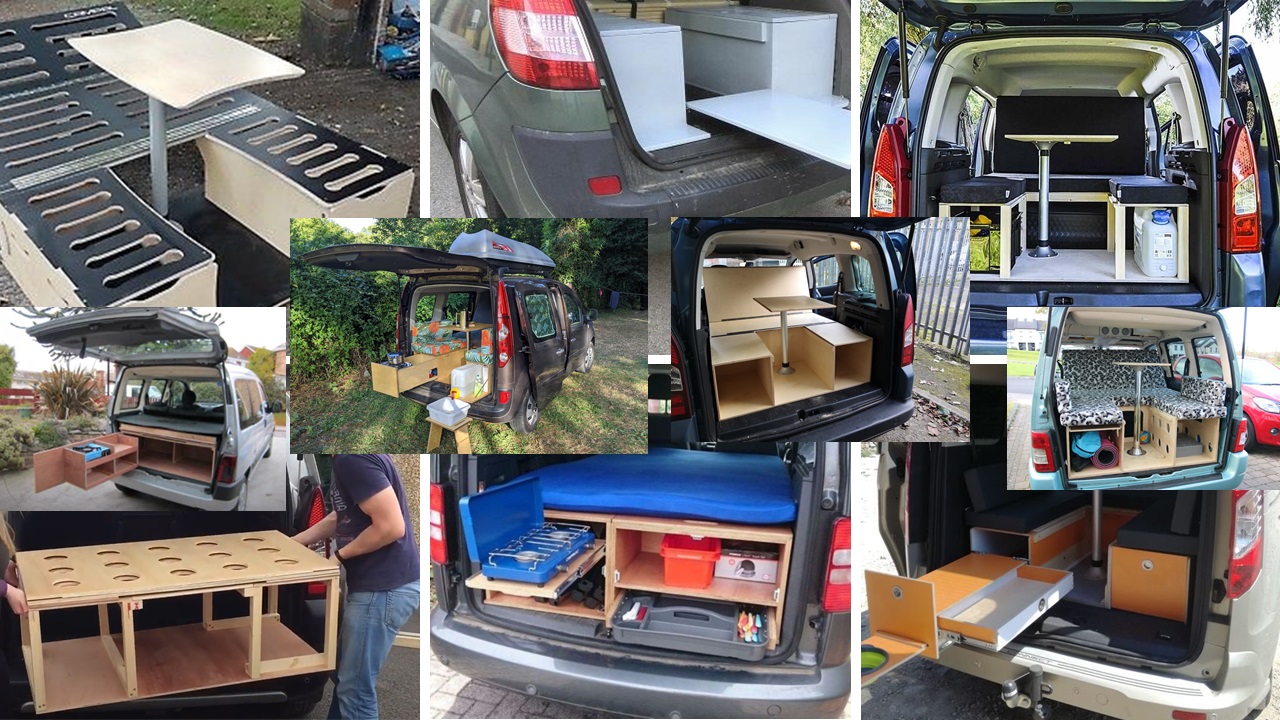
I looked at a lot of boot jump and micro campervan designs. Google images, Pinterest, Reddit, YouTube and Instagram were all great sources of inspiration. Every time that I saw a new design, I tried to look at their details and figure out how they solved each of the design problems I was facing.
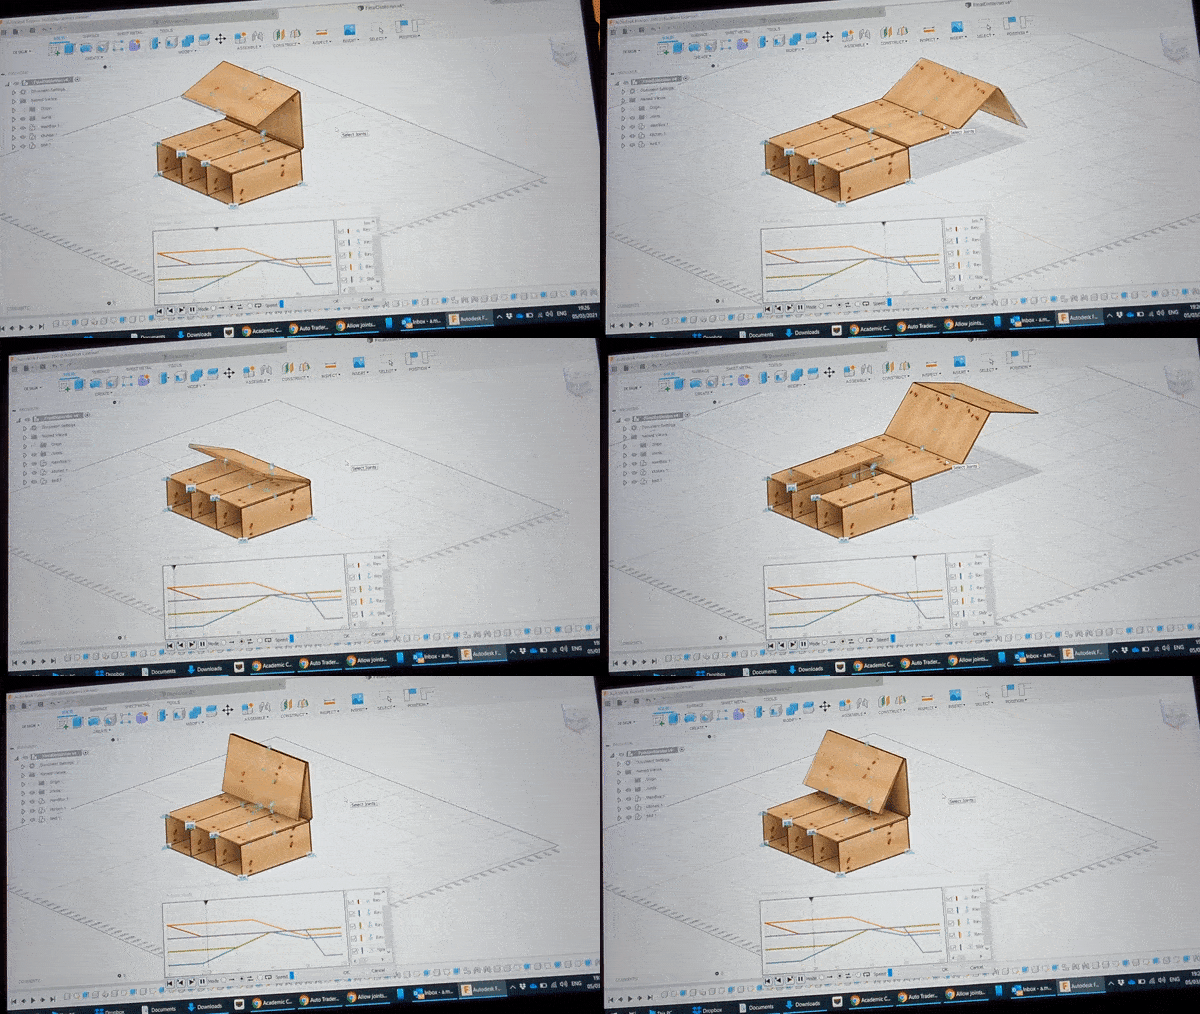
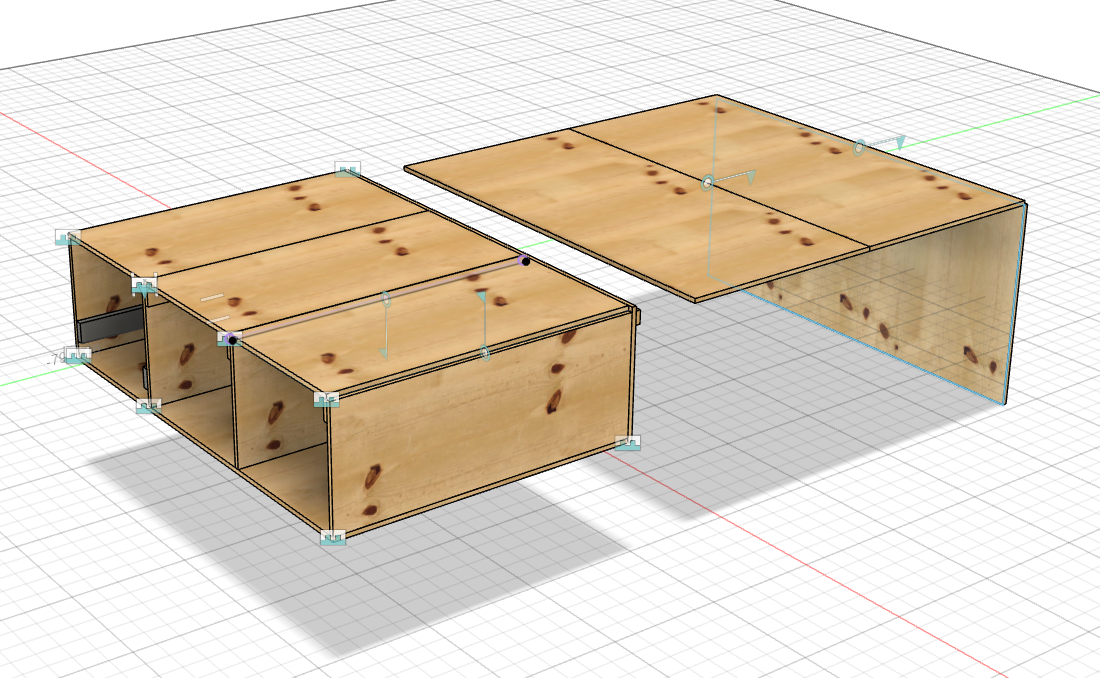
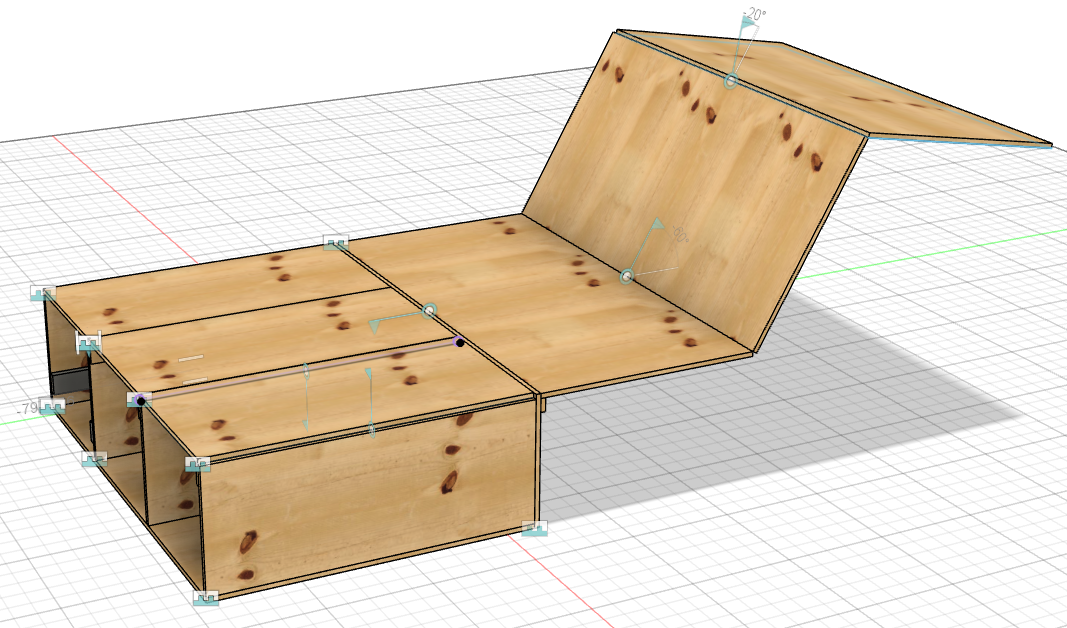
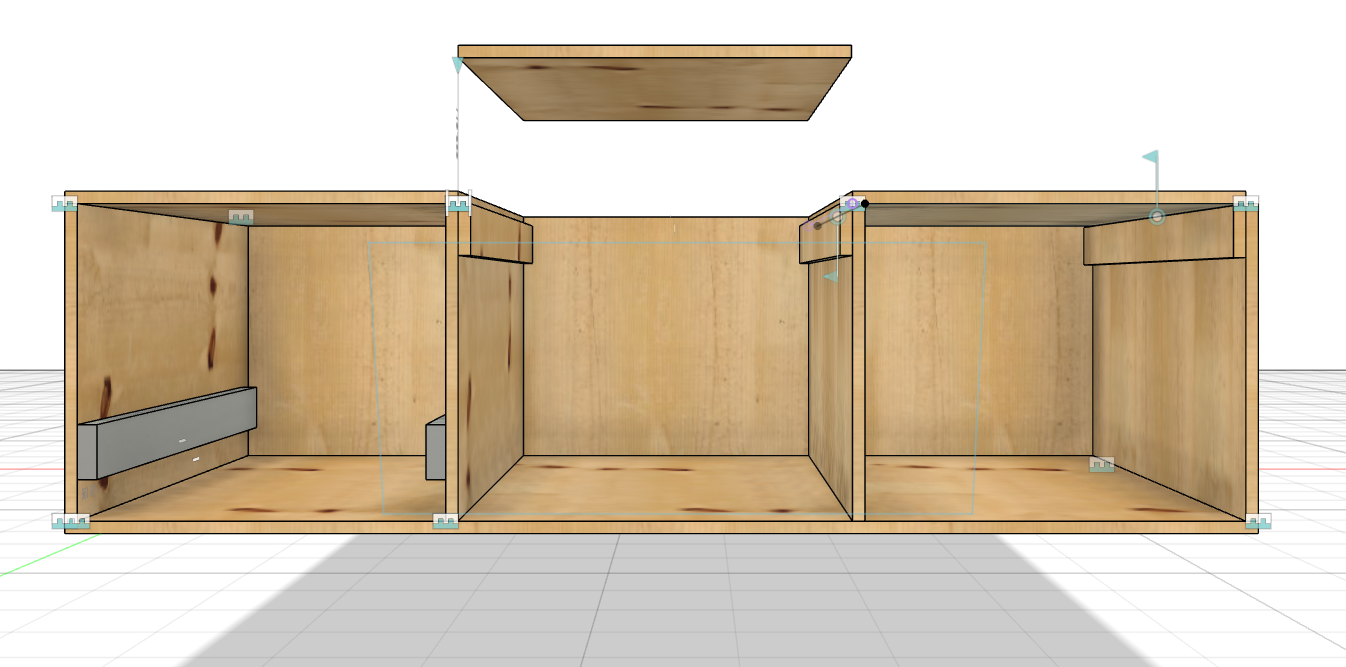
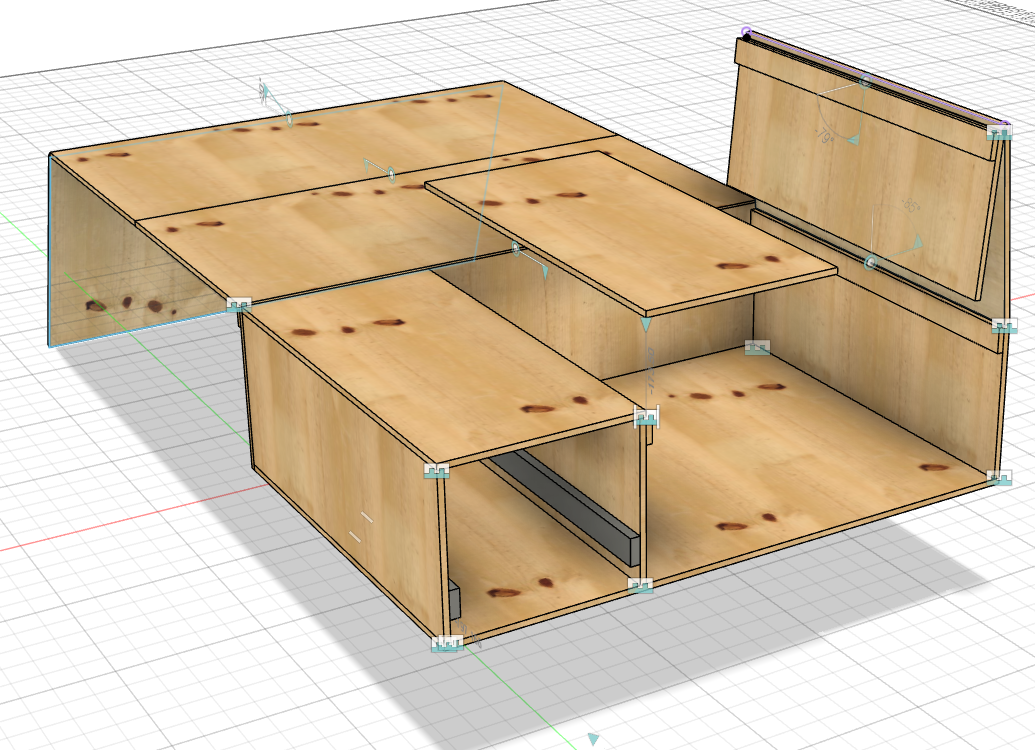
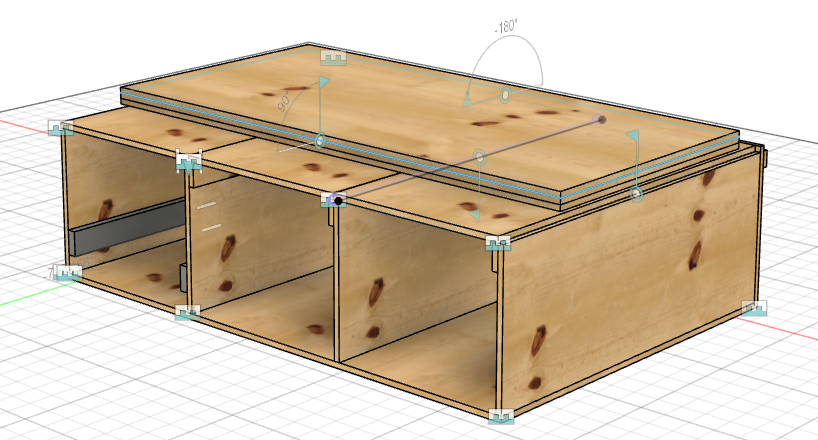
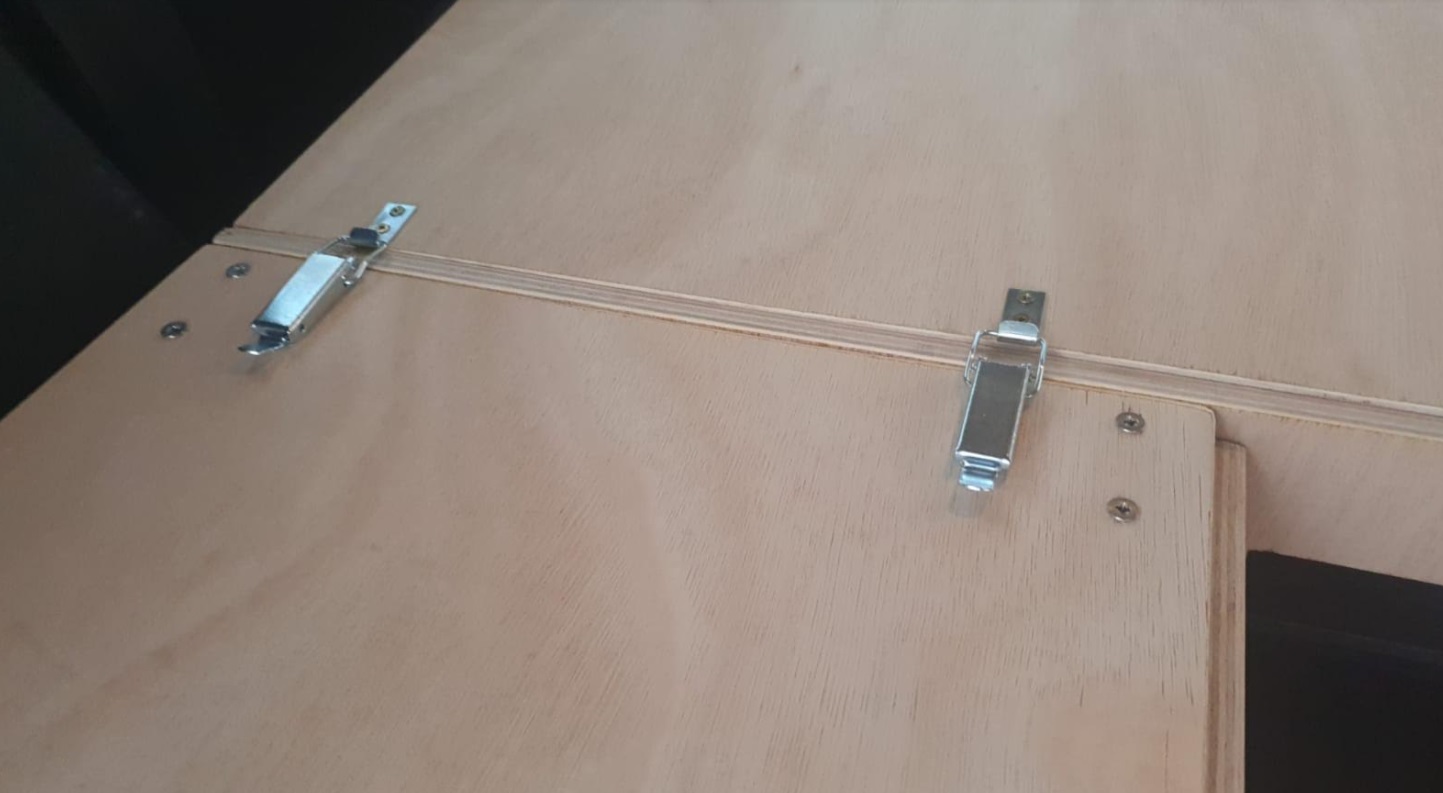
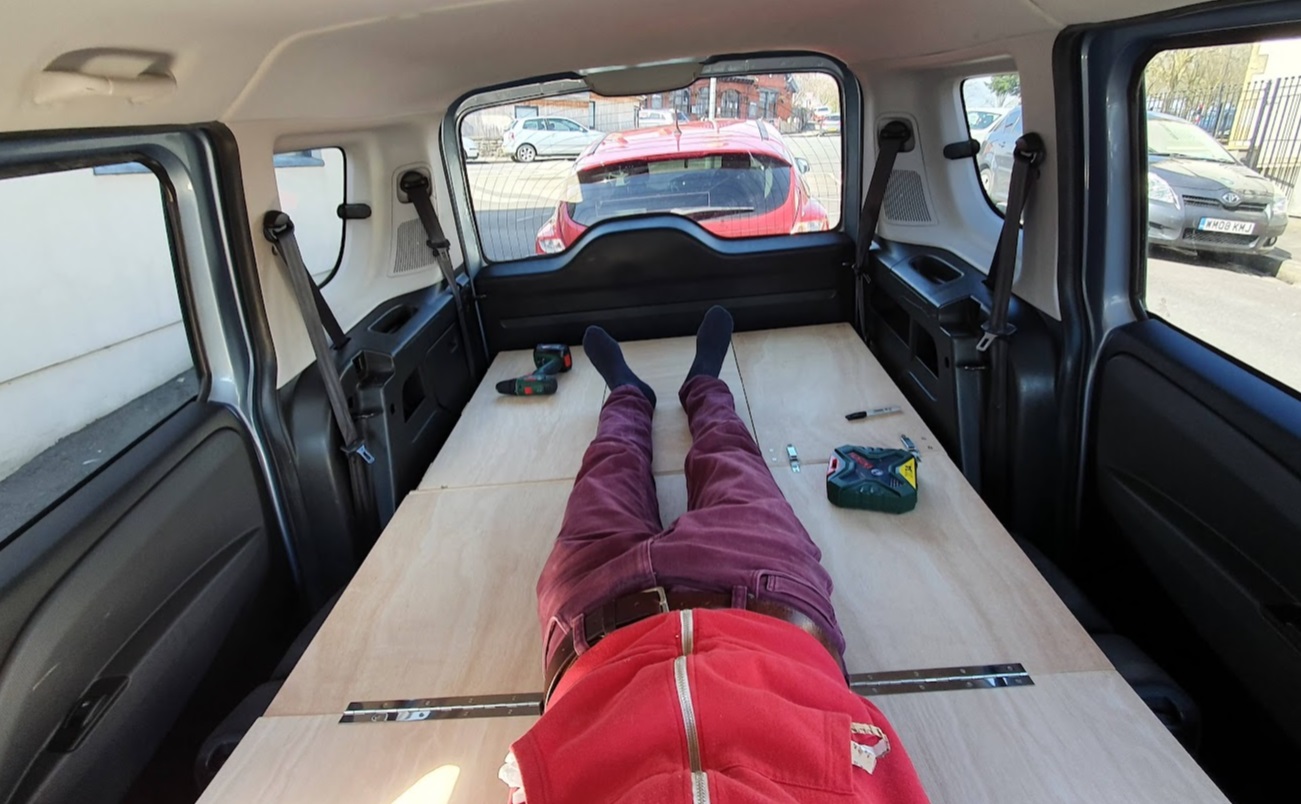
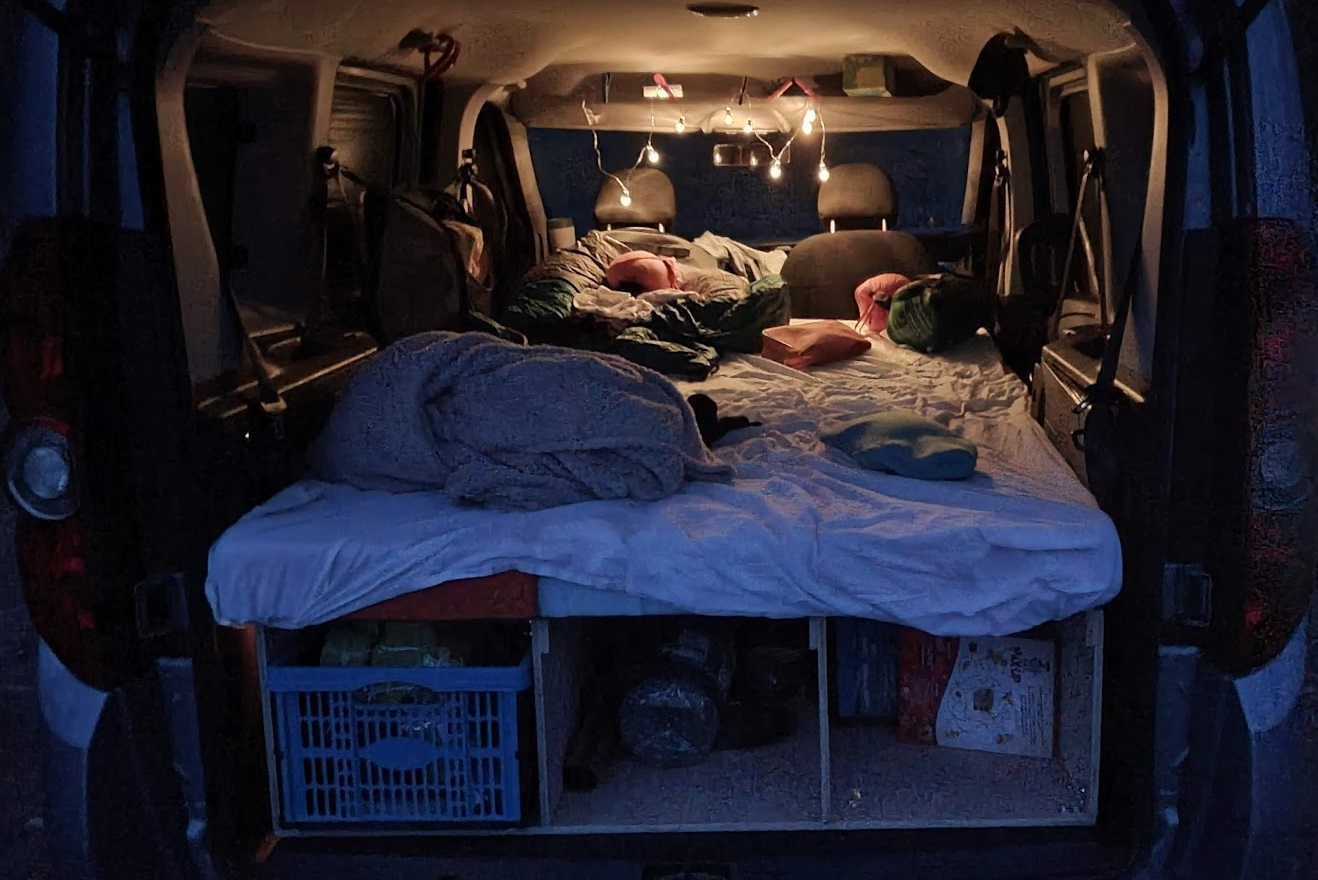
In the end, after talking to my dad, many friends, and people on Reddit, I came up with this design. At this stage, I only focussed on the bed/table box and left the kitchen for a later time. The bed is composed of three different sheets of ply hinged together: two of them compose the bed (together with the main box) while the third one folds down and sits on the floor of the car (behind the front seats). The two boards forming the bed rest almost entirely on the back of the rear seats, which are folded down when the bed is in position (not in the picture). The entire bed is then attached to the main box using toggle latches.
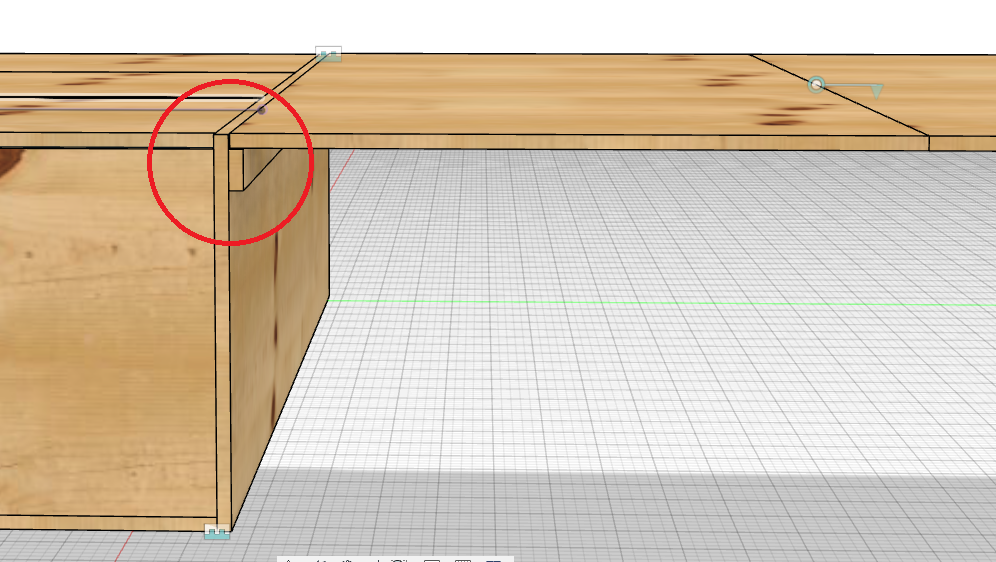
Along the entire length of the main box, I also installed a narrow wooden plank (red circle in the figure) that helps support the bed when latched in position.
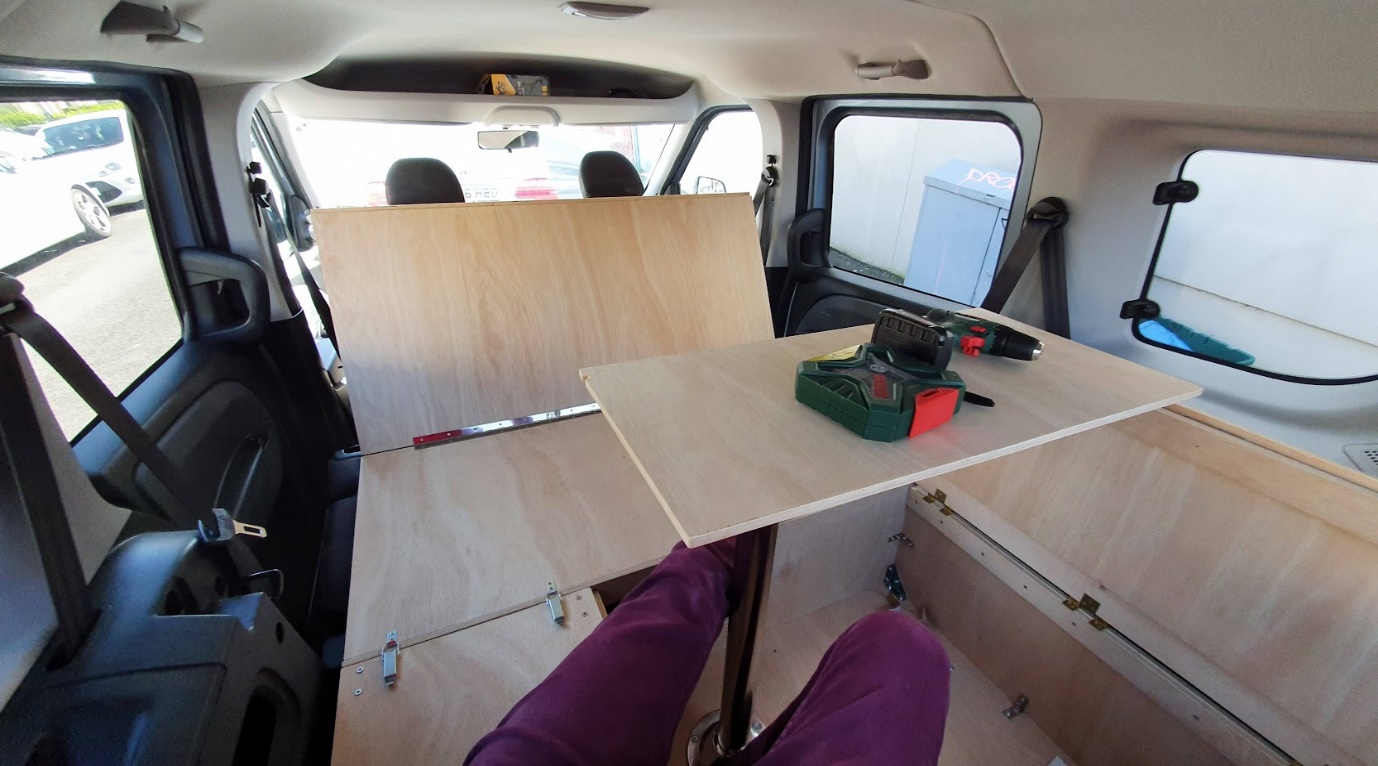
When the structure is set up as “sofa mode”, the middle board of the bed folds upwards and the legs bend so they can rest on the headrests of the front seats (not cut to shape in the CAD figure).
Looking at the main box, the lid of the central space is removable and, in bed mode, rests on top of two planks protruding from both sides of the middle box. When removed, it becomes an island table that rests on a removable metal leg that fits together with the base of the box (not pictured in the CAD figure).
The right side of the box can be used as a bench for sitting at the table, or it can be folded away completely to get more floor space.
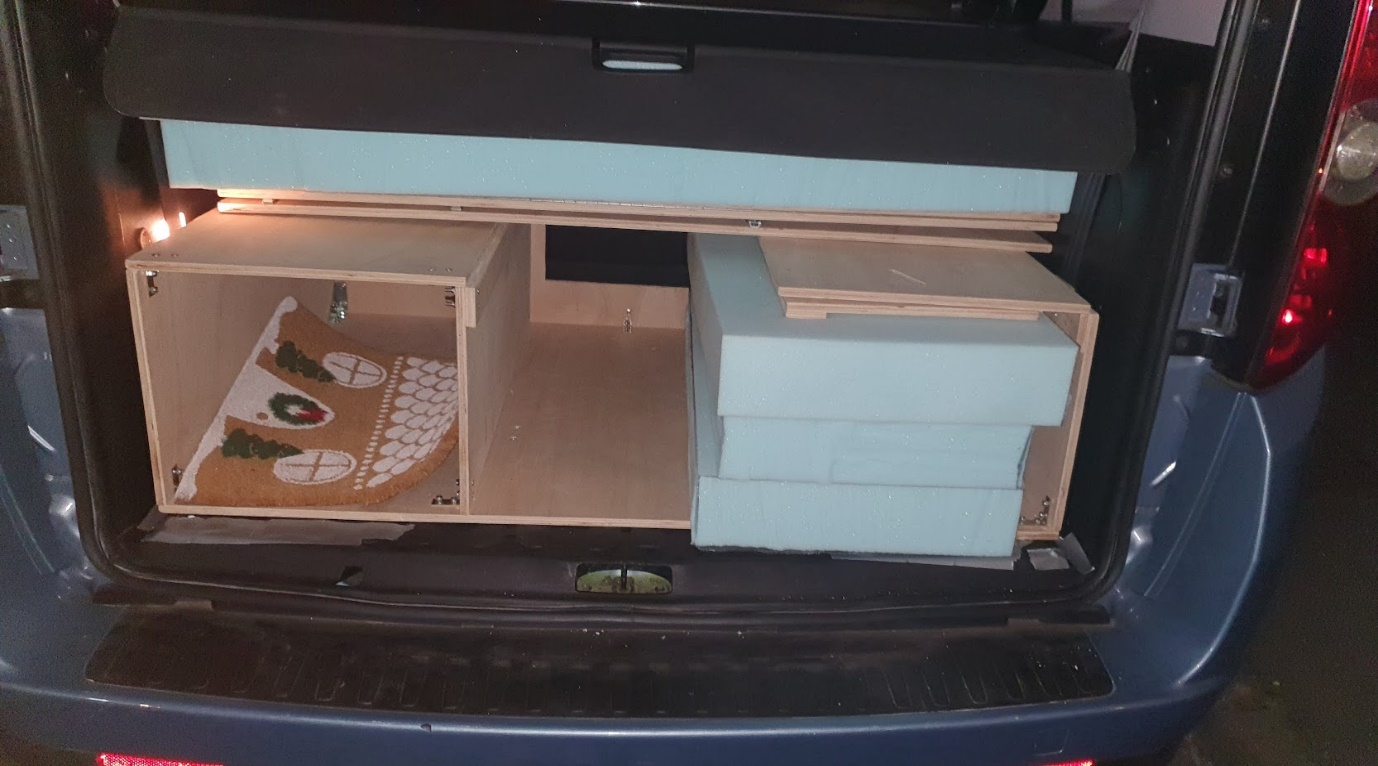
When not in use, the bed detaches from the main box using the toggle latches, folds back into one piece and slides on top of the main box, so that it can fit entirely in the boot of the car.
The measurements
With all the pieces put together into CAD, it was now time to give my boot jump some real measurements, so that I could get all the pieces cut from the woodshop. My first approach was to keep working in CAD. If I got my hands on a realistic 3D model of the van, I could properly size and test every single part of the conversion before getting it cut. Unfortunately, I could only find models of the exteriors, and when I tried to create my own model, I realised how daunting of a task it would have been. You don’t realise how complex are the shapes and curves of modern cars until you try to model them in CAD!
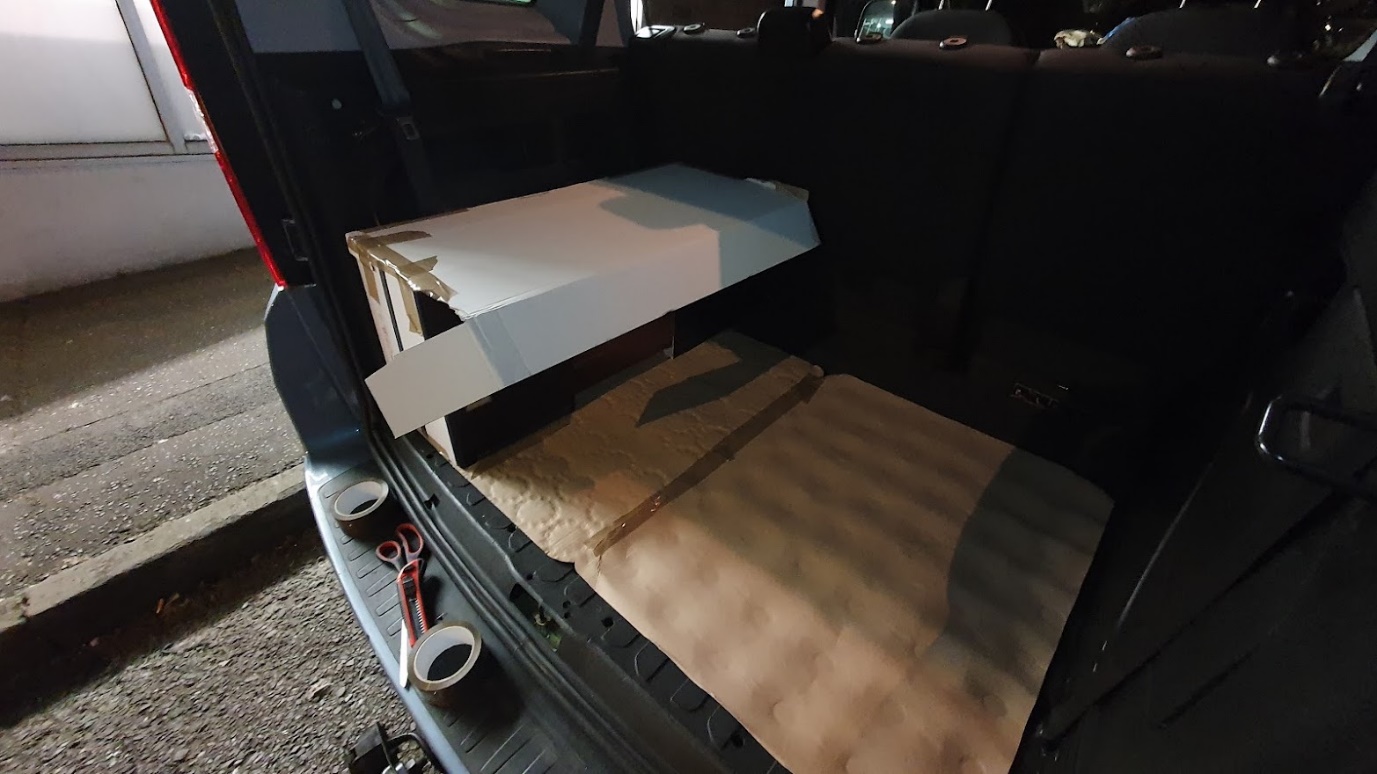
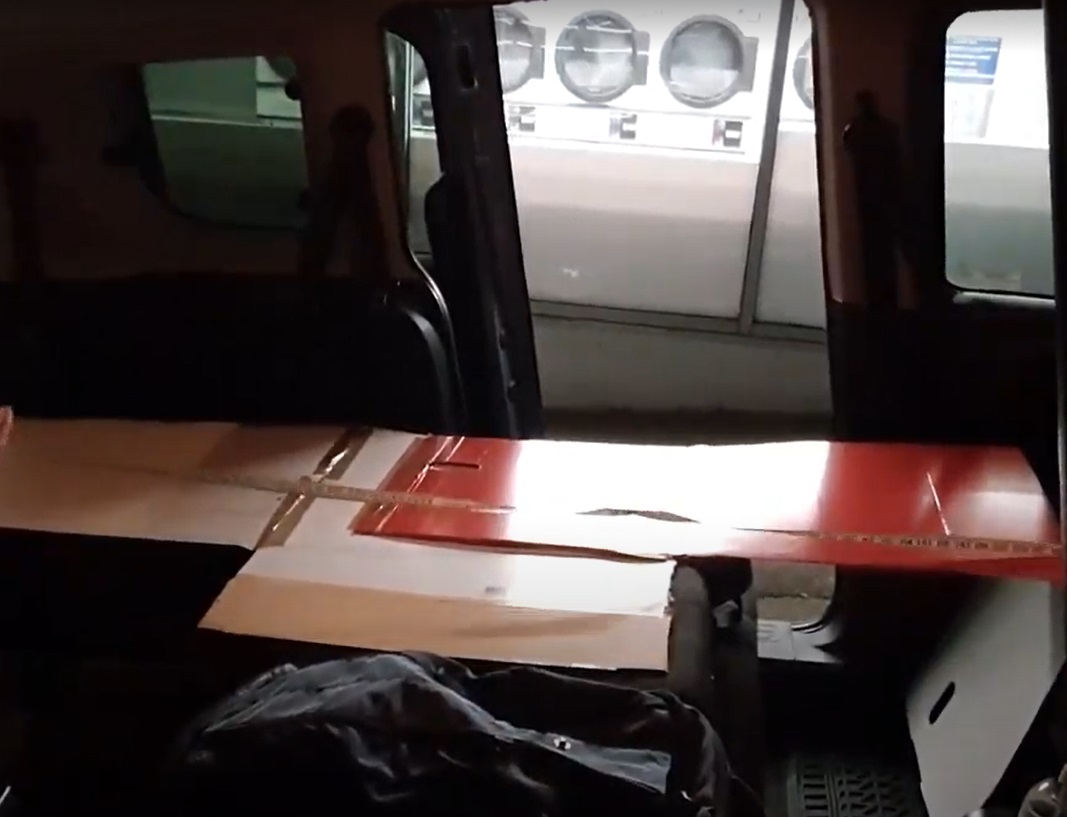
In lack of alternatives, I decided to take all the measurements manually. To make sure that all the pieces fit together nicely, I simply got all the empty boxes I could from a local supermarket and started creating my simplified mock-up version of the boot jump out of cardboard and tape.
It wasn’t pretty. And it wasn’t stable. But it worked! Using this mock-up version, I could make sure that the box fitted nicely in the boot when the back seats were up, that the bed was lying flat when open and that the height of the box was enough for me to sit upright without touching the roof of the car.
With all the parameters updated in Fusion 360, I was ready to create a cutting list. Thankfully, Fusion 360 has a handy plugin that does it automatically for you.
In terms of wood type, I decided to go for Hardwood Plywood (Q Mark) of 12 mm, which seemed to be solid and durable. A few days after contacting the woodshop, my order was ready to pick up.
If you want the exact measurements of the boot jump, you can download them from here:
Assembly
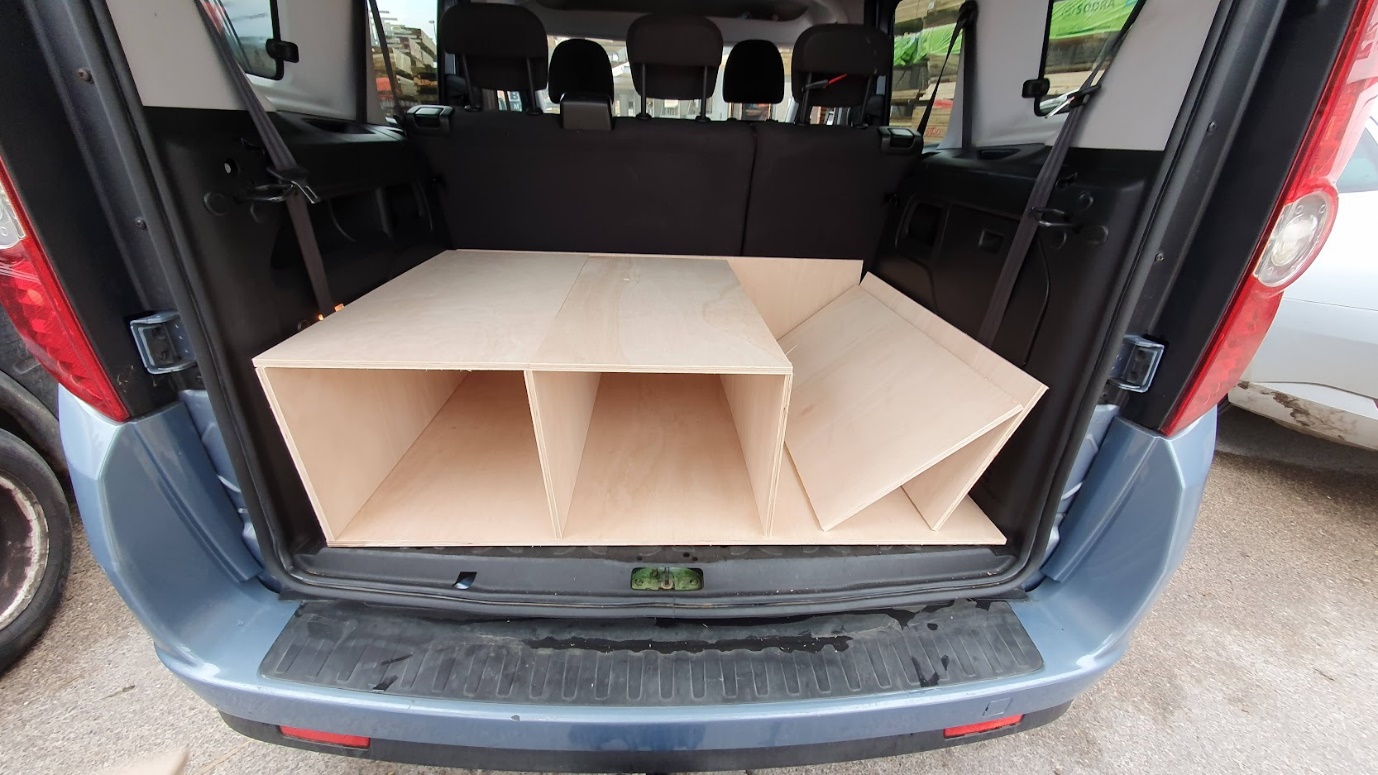
Now that I had all the pieces for my boot jump, it was time to put them together. But before that, I had to figure out how to deal with the joints. Having basically no experience with woodworking, I started googling “wooden joints” and a whole new world opened in front of my eyes… Biscuit joint, pocket joint, dove tail, tongue and groove… Each with its strengths and complexities, but most importantly, each requiring fancy wood tools that I didn’t have nor intended to buy or learn how to use! The easiest thing would have been a basic butt joint, which simply means flushing two parts together and either screw or glue them. However, screws would have to go in the direction parallel to the plies, which weakens the structure. I also didn’t like the idea of using permanent fixing since I didn’t know if my assembly process was going to work. I mean, even when you follow instructions from IKEA, you often realise you did something wrong and need to undo everything and start from the beginning. And I had no instructions…
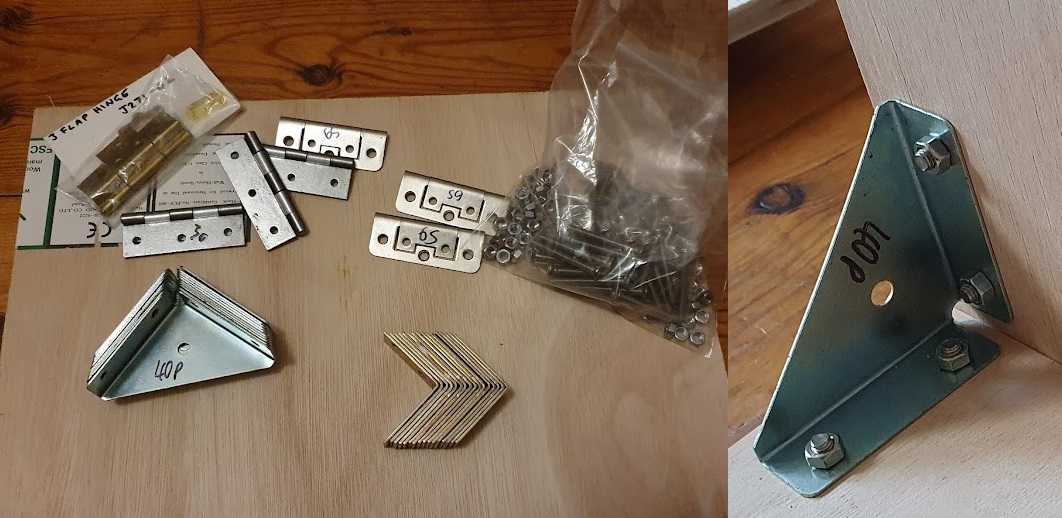
After a quick trip to the local hardware store (one of the many, many, trips after that) and some chats, I decided to go for the bolts and nuts solution. I bought a bunch of metal corners, L-shapes, a ton of bolts, nuts, washers, and started putting the entire structure together. For the entire process, the only tool that I had to buy was an electric drill (basic Bosch one for £55) with a set of drill bits and screwdrivers. A couple of wrenches also made my life easier during the entire process.
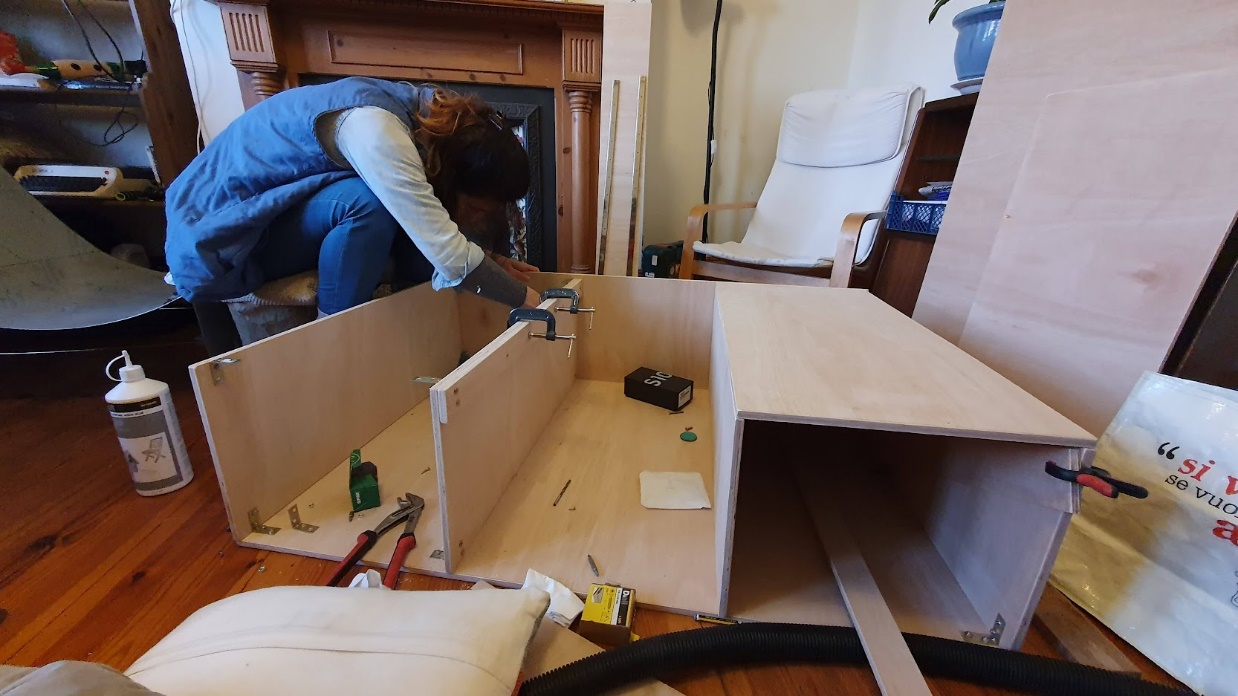
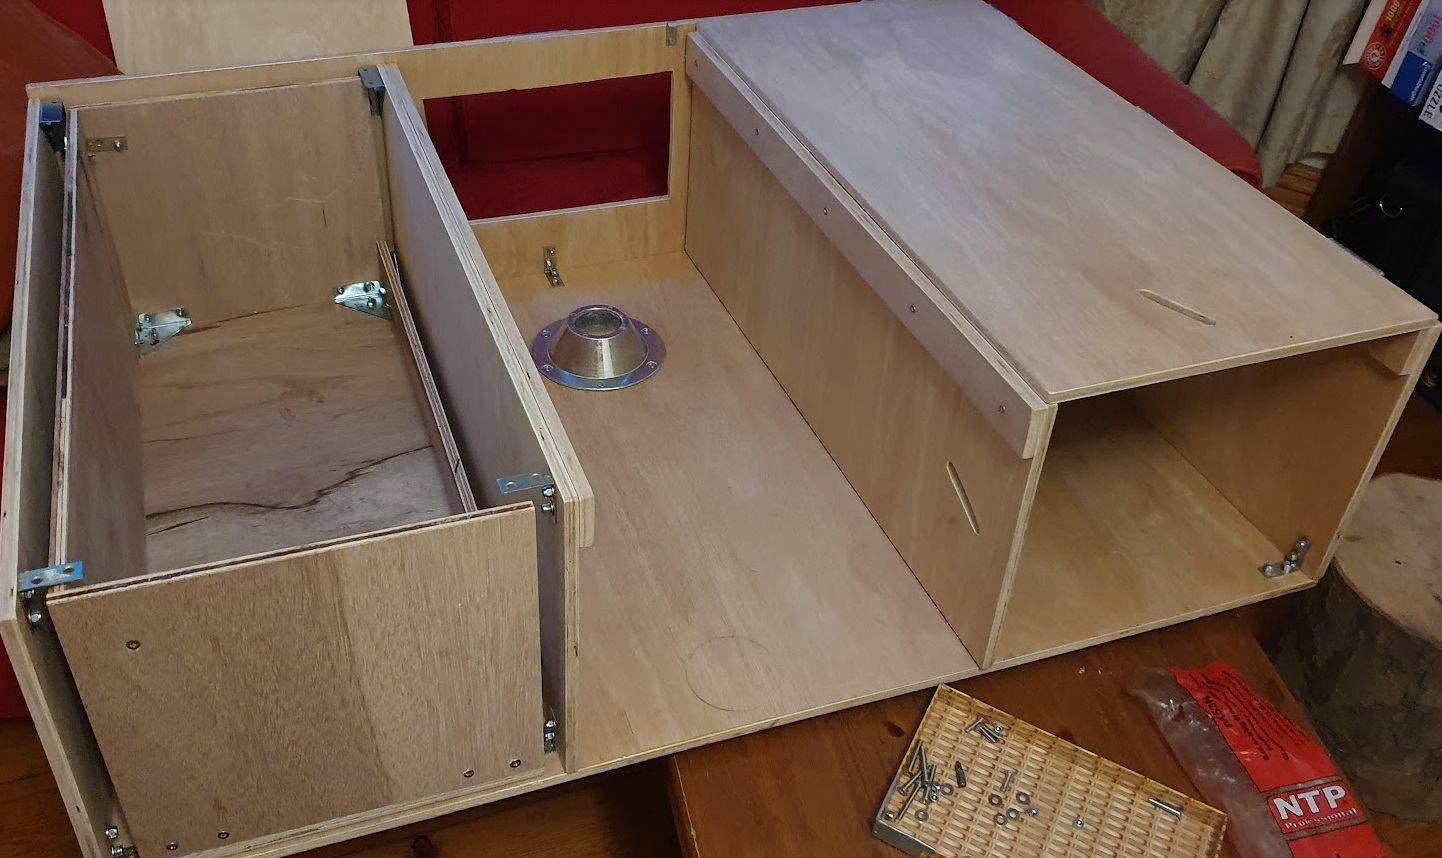
One of the hardest thing of the assembly was probably putting together the first three pieces, since I had no reference, no stable structure and nothing to work on. Bit after bit, and a whole weekend later, the entire structure started to take shape. During the process, having my laptop open in front of me was immensely helpful and I was so glad I had the model to use as a reference for the assembly. I would definitely recommend that to anyone designing a conversion kit from scratch.
In terms of hinges, I used three different types. For the bed, I used piano hinges, which are really thin and have many holes, so they distribute the pressure on many different points. For the foldable bench, I used standard hinges for the flap side and flush door hinges at the base, so that the weight of someone sitting on the bench is taken by the entire wooden structure and not by the screws holding the hinges.
One last thing that I decided at the very end of the assembly was to use self-locking nuts instead of standard ones. I’m not sure it really made a difference, but it gave me more confidence that the whole structure wasn’t going to disassemble itself due to the vibrations.
Fitting to the car
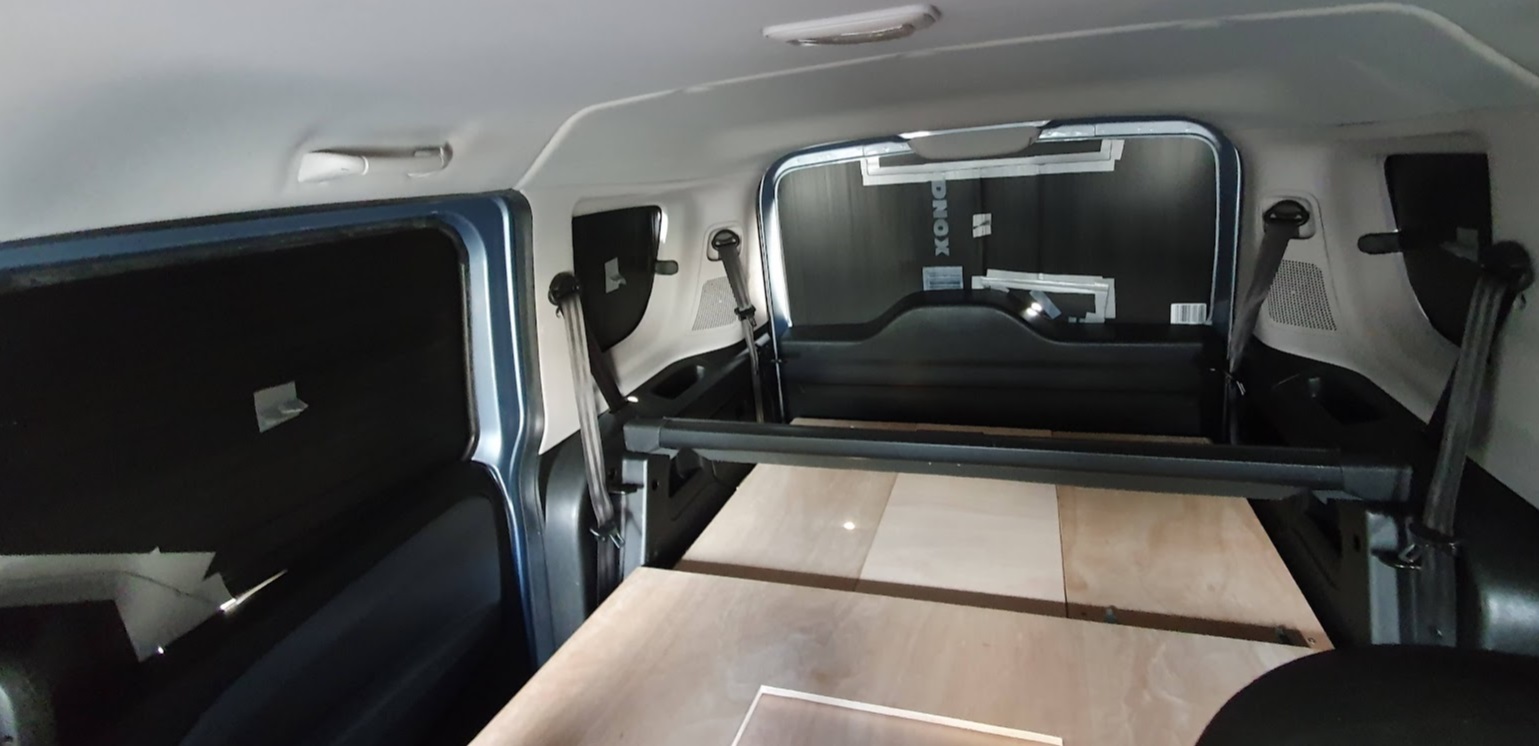
Now that I had a semi-rigid structure that I could move around, I could finally put it in the car and see if it fit… and it did!
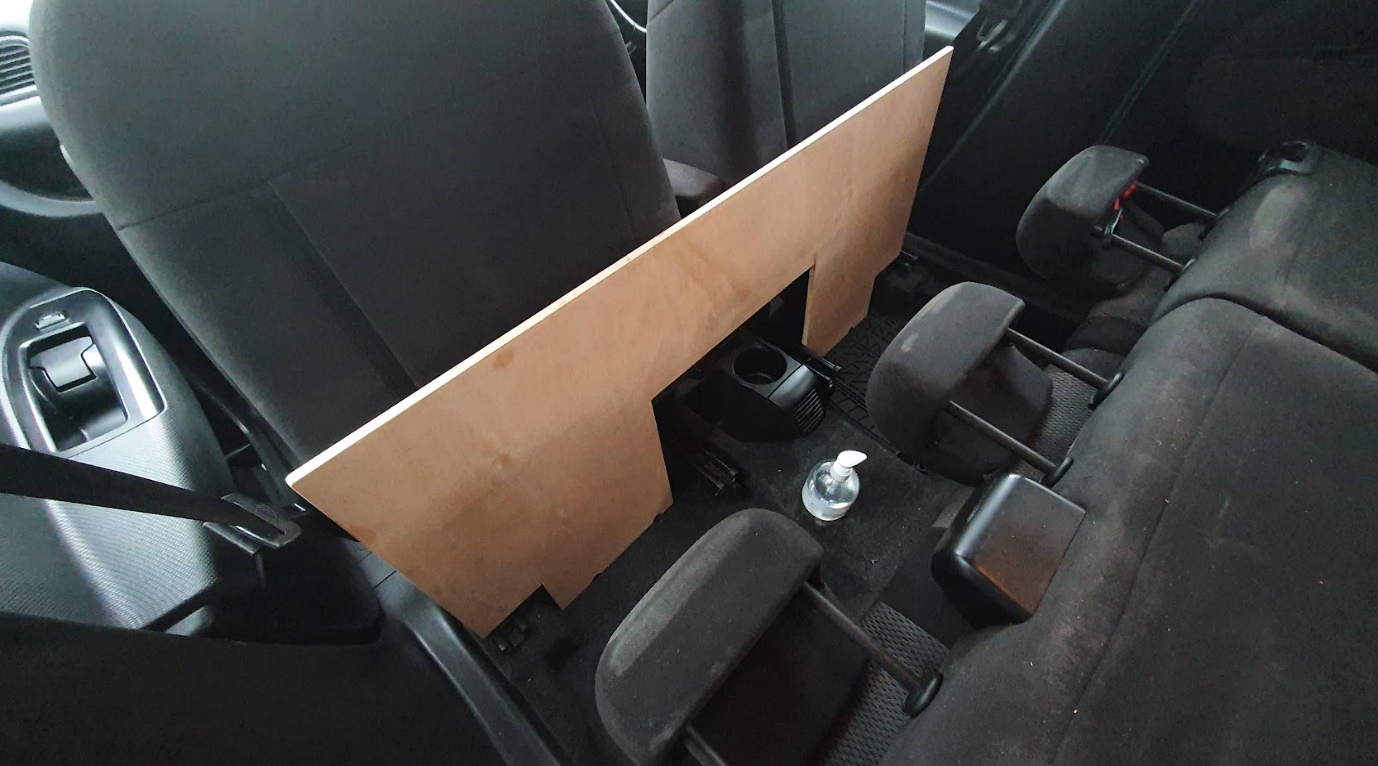
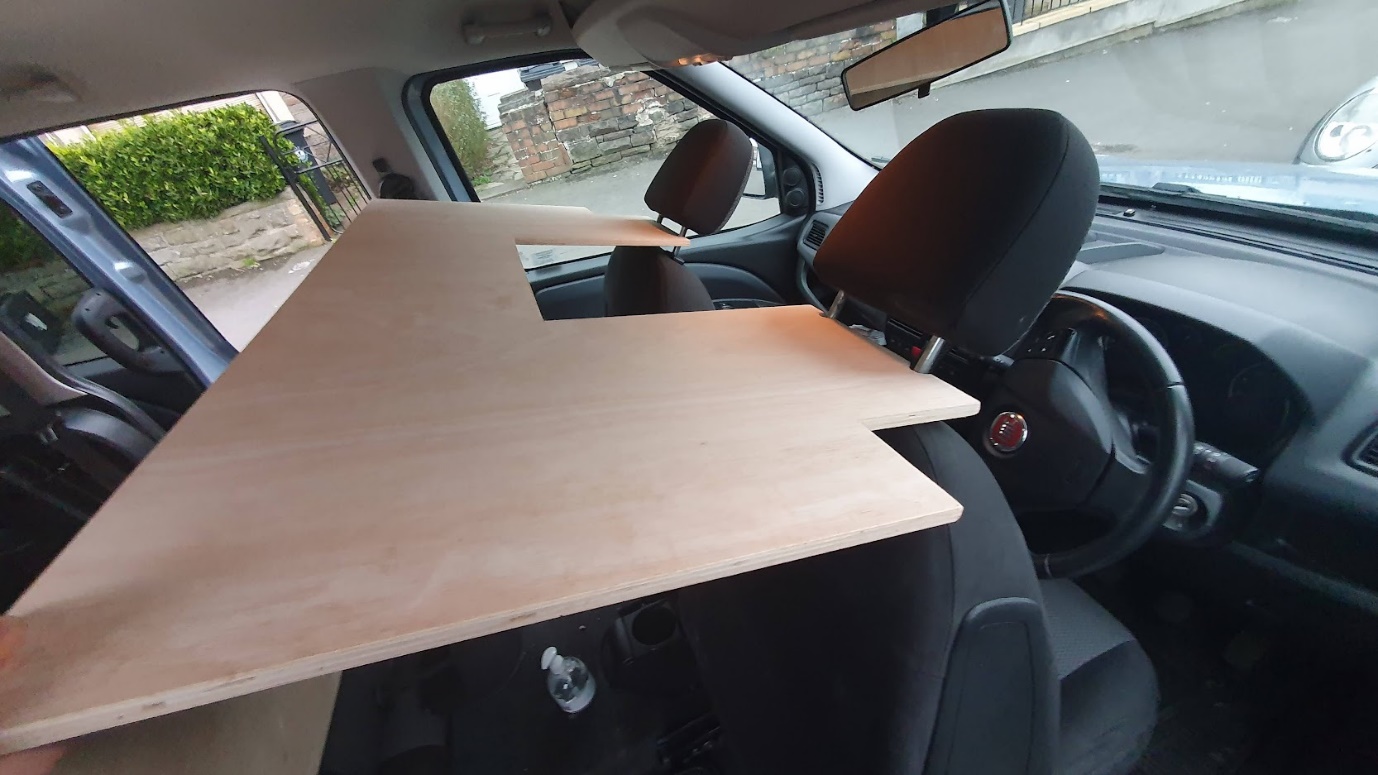
The next step now was modifying the shape of the leg board of the bed, so that it fitted the shape of the car. Since I couldn’t get this done from the woodshop, I bought a cheap electric jigsaw for £10 and cut it myself. Luckily, this cut didn’t need to be straight nor neat. As long as the board fitted in the leg space of the rear seat, it was just fine. I put the leg board in position, took a few marks for the incuts where the obstacles were, made sure it was symmetric and simply cut a few chunks off it.
At the same time, I also made sure that the board fitted nicely on the headrests of the front seats, so that I could use that board as a backrest for the bench when I’m using it upright.
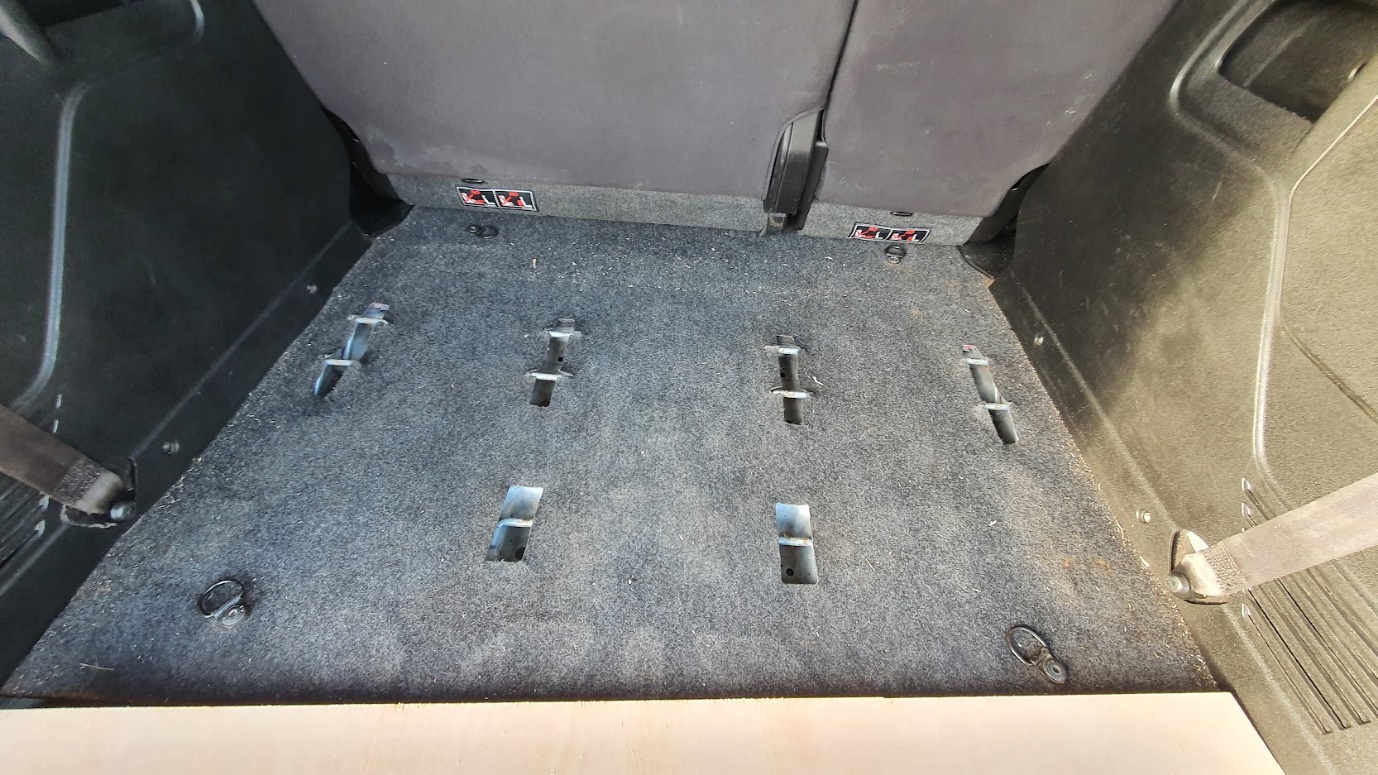
One big issue that I still had to solve though, was how to fix the entire boot jump to the car. The majority of the solutions that I saw online, simply used lateral supports that screw out of the box, press against the side of the boot and keep the box in place. However, the sides of my car are made of cheap flimsy plastic and didn’t really seem suitable for the job. On the other hand, my car came with 7 seats and has some interesting metal inserts on the floor of the boot that I could use to clamp the structure.
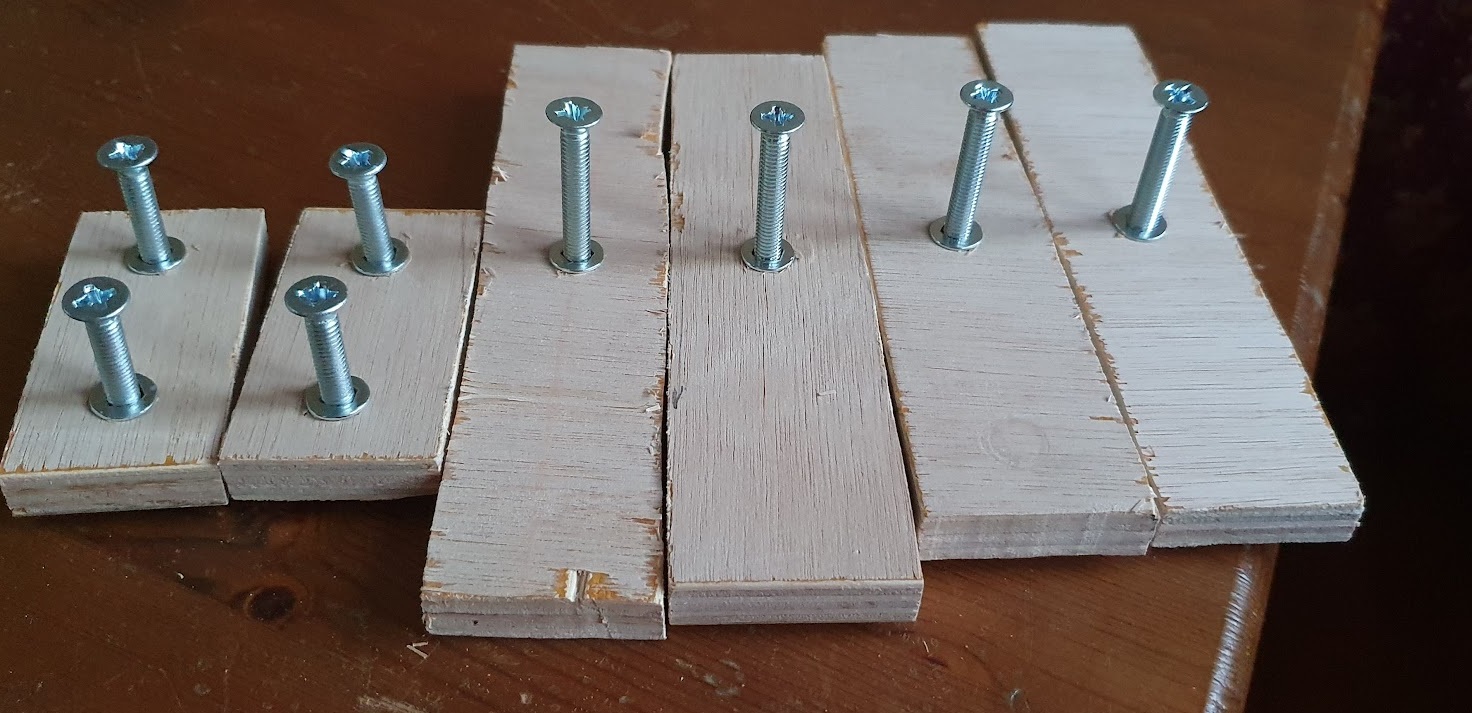
I cut a few wooden rectangles that slide under those metal bars and then screwed threaded inserts into them. On the boot jump side, I simply made a few holes matching those inserts, so that I could use removable bolts to fix the box to the car. Making those holes was a bit of a pain, since I couldn’t see the inserts when the box was in. To solve this issue, I just put a reference frame onto the car with some tape and took very precise measurements for the horizontal and vertical position of each of the holes.
Table
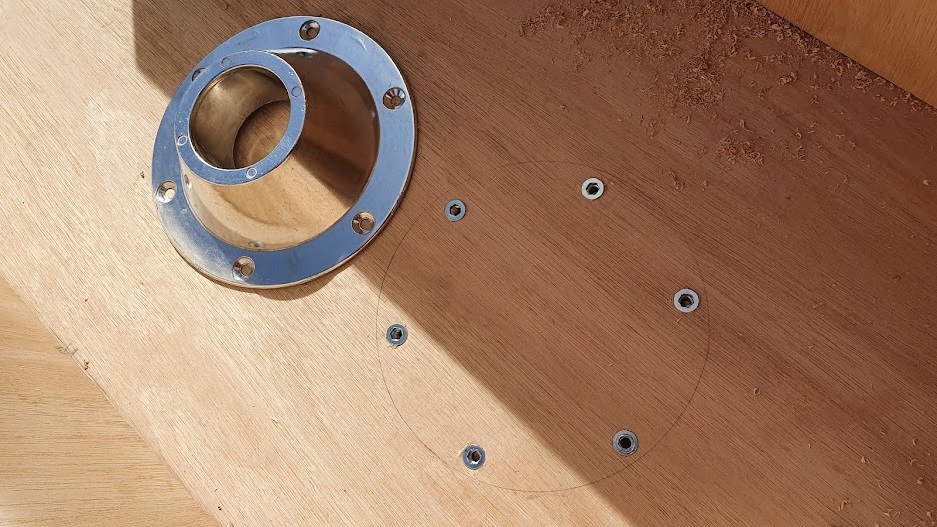
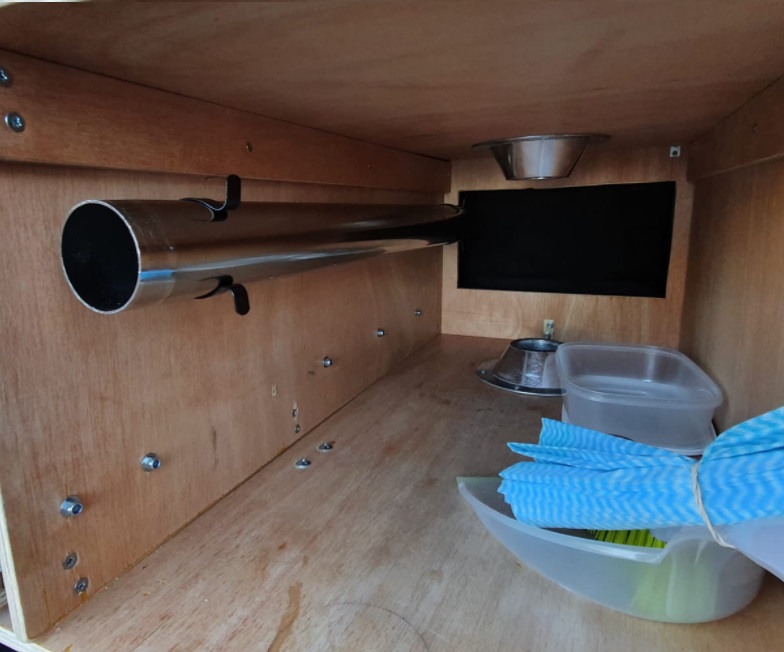
The table was fairly easy to install. If you Google “Island Table Leg Set / Kit” you can find dozens of websites that sell standard table kits suitable for campervans. You can find some very fancy ones, but the basic one is just a metal pipe that is tapered at the ends and that fits together with two conical shapes. One goes on the floor, the other one under the table, as simple as that. Since I didn’t want the base of the table to be permanently screwed to the wooden box, I first installed some threaded inserts on the floor of the box and then fixed the table base using bolts.
As a final touch, I bought a couple of metal clips that I screwed on the side of the box and hold the table leg in position when I’m not using it.
Cushions
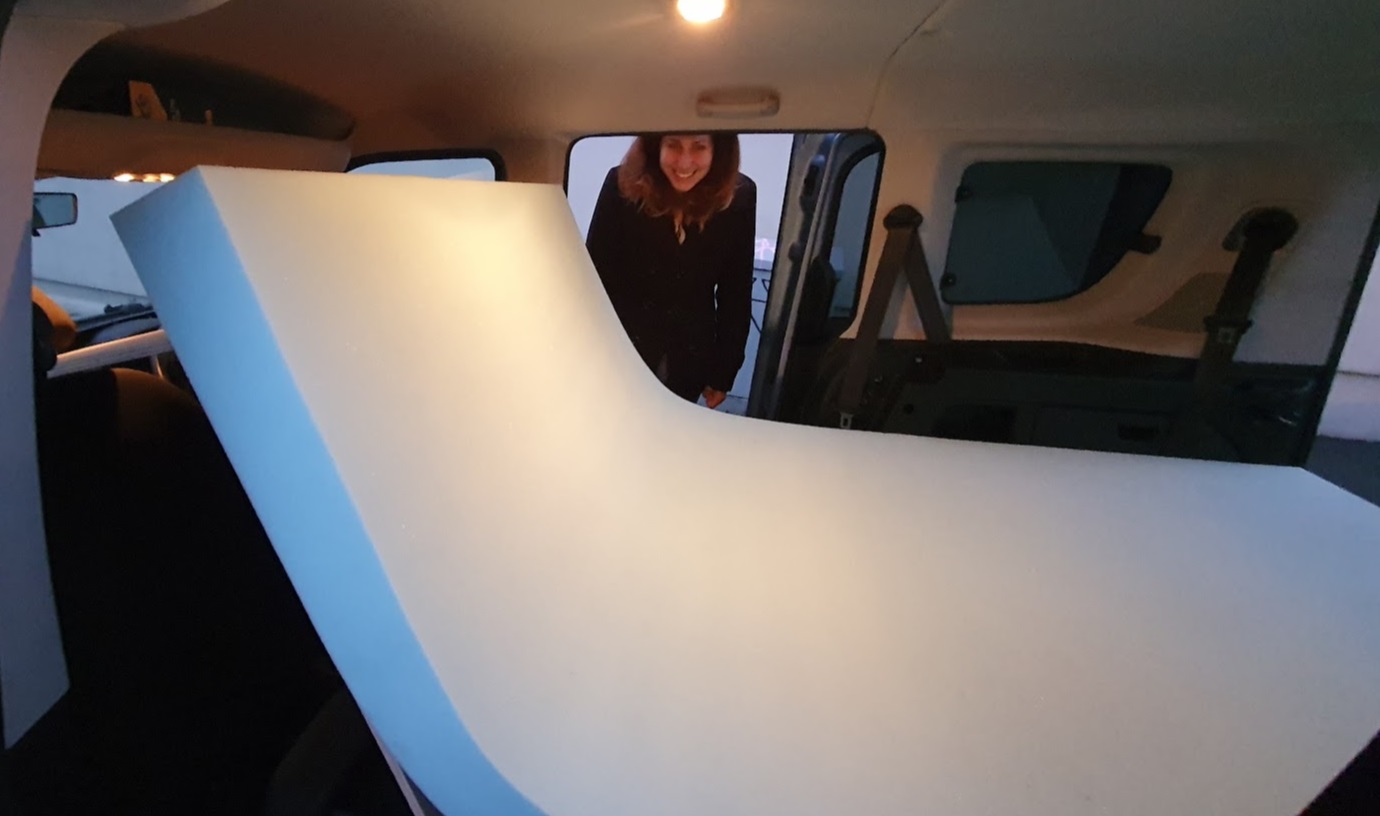
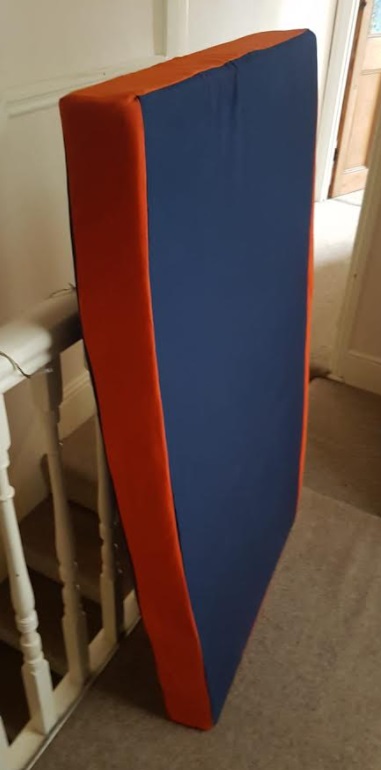
The most important part of the bed was obviously the mattress. While you could easily use the boot jump with an inflatable mattress, there’s no comparison to how comfortable a real mattress can be. Some companies sell custom made cushions for vans, using the materials and shapes of your choice, but they aren’t cheap. The cheapest solution that I could find was buying the foam for the mattress, cut it myself to shape and then sew the upholstery to cover them. But which mattress? All the standard mattresses that I could find weren’t quite the right shape to fit the entirety of my bed. Luckily, I found a really good and cheap company that makes foam mattresses cut to size, eFoam. On their website, you can order whichever custom size you want, from 2” to 8” thick. I decided to go for 4” high density (firm) foam for £134, and it’s just perfect.
The next step was cutting it to shape, so that I could have two main cushions for the bed, and three smaller ones for the benches and the top of the table. I simply laid the mattress over the bed and marked the points where I wanted to cut. From other conversions that I saw, people seemed to have a really easy time cutting the foam using electric bread knives. I’m not really sure why people own electric bread knives, but I couldn’t find any, so I had to cut it by hand. And it wasn’t easy… Cutting a giant wobbly structure trying to follow a straight line is a harder problem than you might think, and the result wasn’t that neat…
The good news is that the cushions were going to be covered with the upholstery and no one is ever going to see how bad those cuts are.
As for the upholstery, I didn’t do it myself, but I asked a friend with a sewing machine, Frida. She’d never done anything like this before and didn’t have much experience with the sewing machine either, but with a bit of patience and a lot of YouTube tutorials, we managed to get all the cushions done. For the fabric, I ordered it from Lushfabric and spent around £67 for 7.5 metres of material.
Blinds
The greatest thing about converting a car into a van is that it has a lot of windows, and you can enjoy the view from wherever you sit inside. However, the worst thing about converting a car into a van is that it has a lot of windows that you need to cover when you go to bed! Either for privacy or just to make it dark, you want to cover those windows. Once again, they do sell pre-made thermal blind kits for all the windows of my car, but they come at a hefty price tag (£150!). For a much cheaper price, I managed to buy a £5 corrugated plastic sheet from B&Q that is typically used to insulate roofs and stuff. I simply cut it to shape for each window and sled it through the glass seal to keep it in place.
In terms of making it dark and insulated, this works very well. However, sliding those panels into place through the glass seal is a real pain and it’s the last thing you want to do when you’re tired at night and just want to sleep. In the future, I’m planning of adding some magnets to them (keeping them in place with duct tape) so that I can simply chuck them at the window and they will stay in place by themselves.
Finishing touches
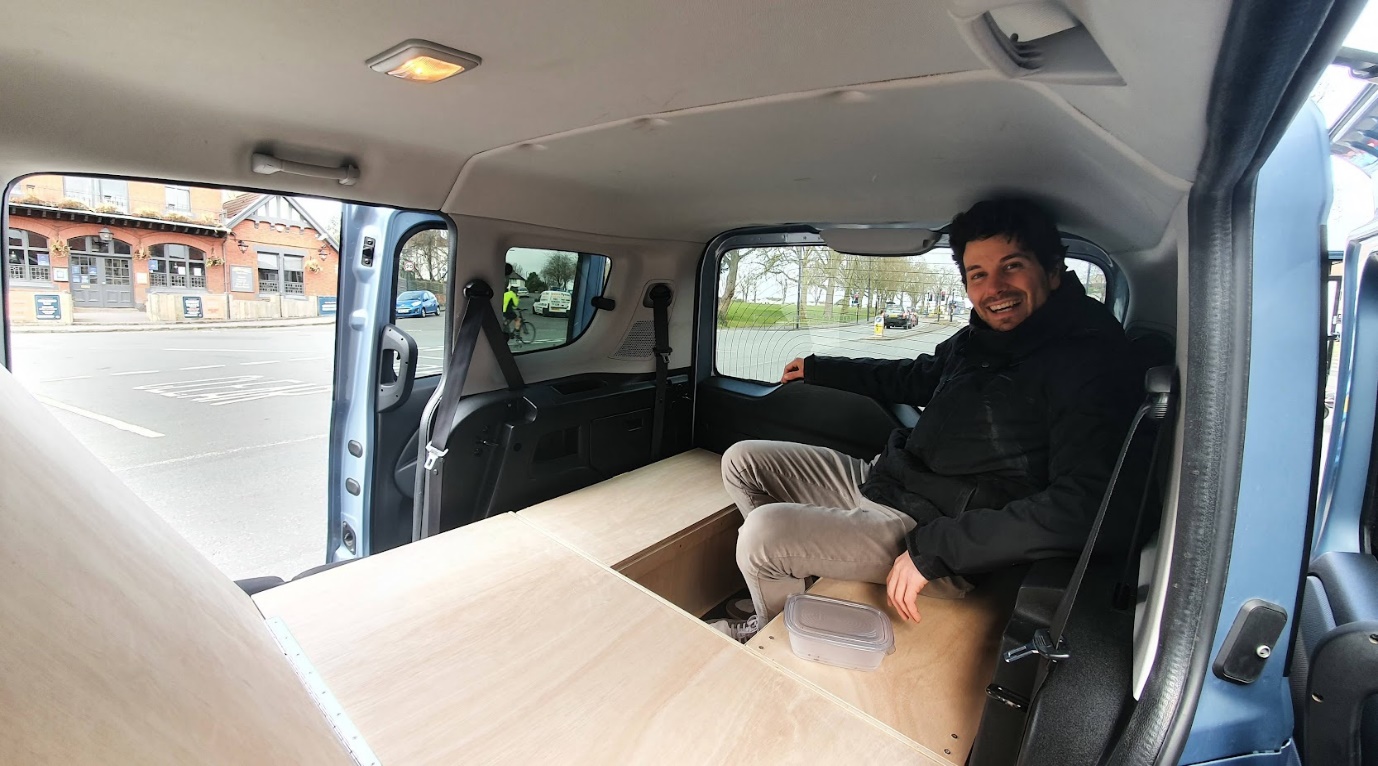
At this point, the boot jump was ready for its first night out. I could use it bed mode
I could use it in “sofa mode”
and I could pack the entire structure in the boot without taking any space from the rest of the car
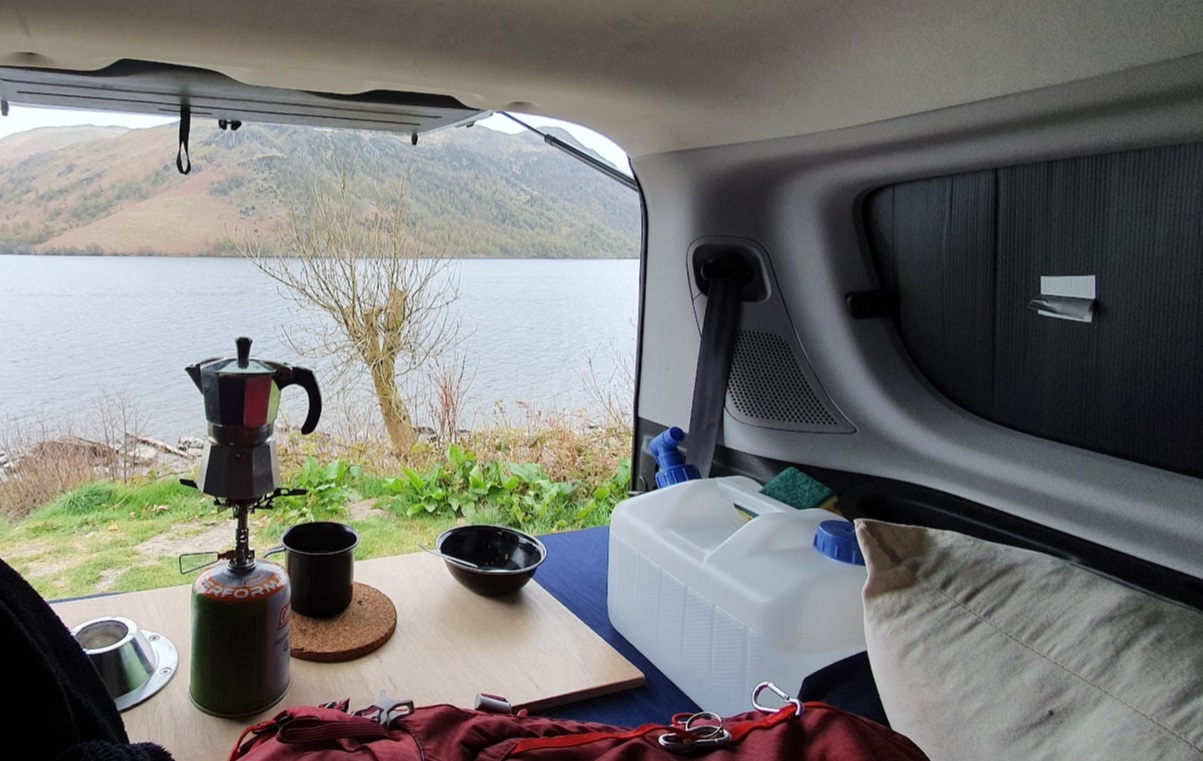
All I needed was a couple of finishing touches before getting on the road. I used a single coat of varnish on the entire structure to protect it, and a triple coat on the table, so that it wouldn’t get too dirty. I also installed some fairy lights on the top shelf of the car, so that I didn’t need to use the car battery for illumination. To make sure I didn’t depend on stupid AAA batteries for the light, a bought a couple of USB DC-DC 5V to 1-24V adjustable adapters. They’re really neat (and cheap! Less than £3 on AliExpress), you plug them into a USB (like a battery pack) and they have a potentiometer to adjust the voltage in output. I simply cut off the wires from the fairy lights, screwed them into the adapter and ended up with USB-powered adjustable fairy lights. To hold them in place on the shelf, I simply used foldback clips (not yet installed in the picture).
At this point, the van was ready for its first night out!
The kitchen
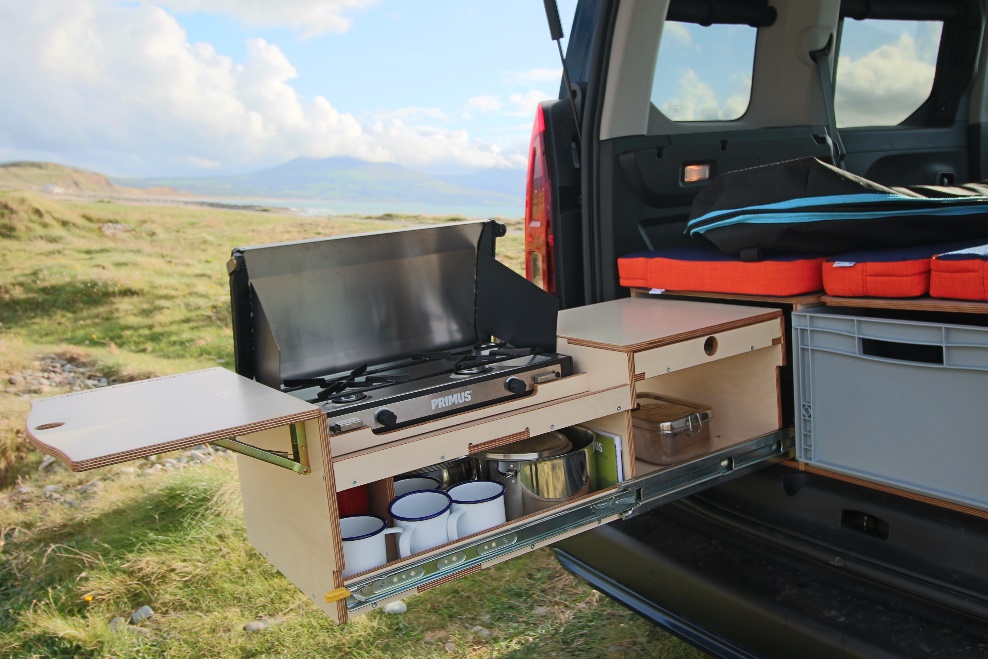
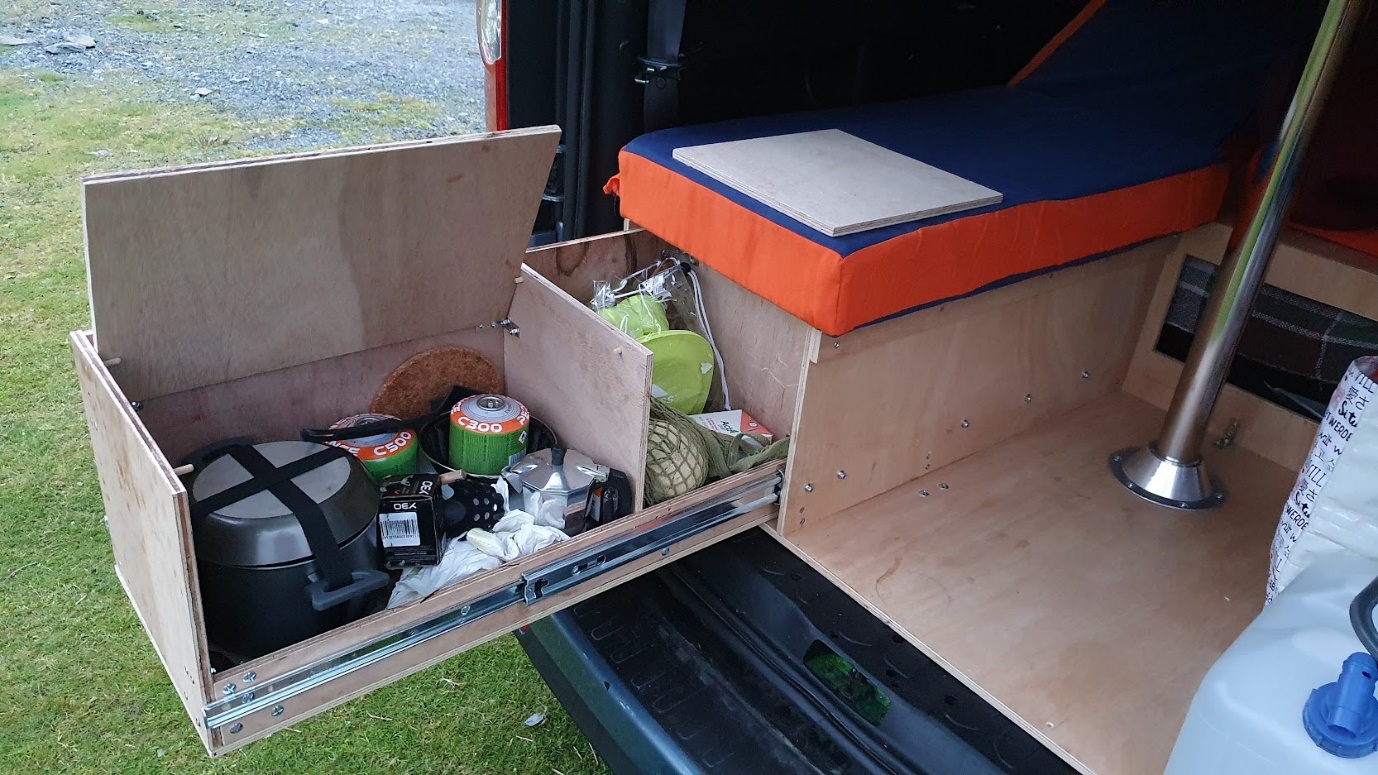
The next chapter of the conversion concerns the kitchen. I only worried about this later, since I didn’t know exactly what I needed. But after a few months of vanning, all I knew is that I definitely needed a kitchen. I wasn’t sure exactly what this would have looked like, but I liked the idea of it being a drawer that sled off the side box of the boot jump.
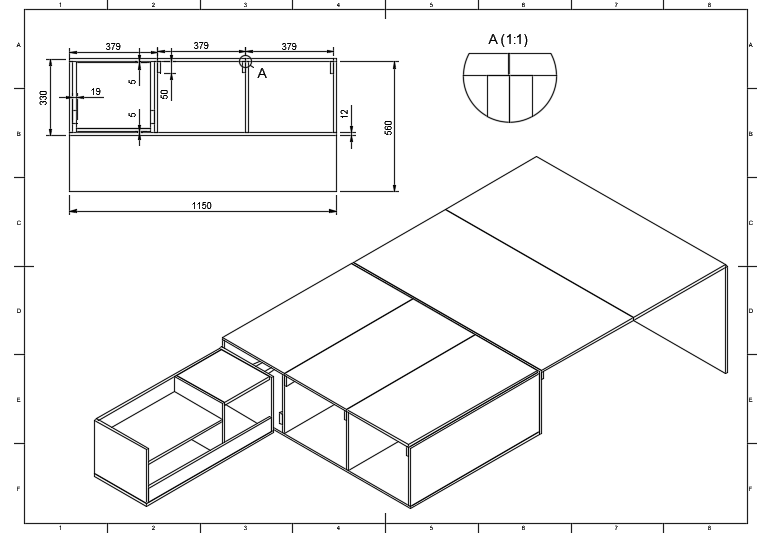
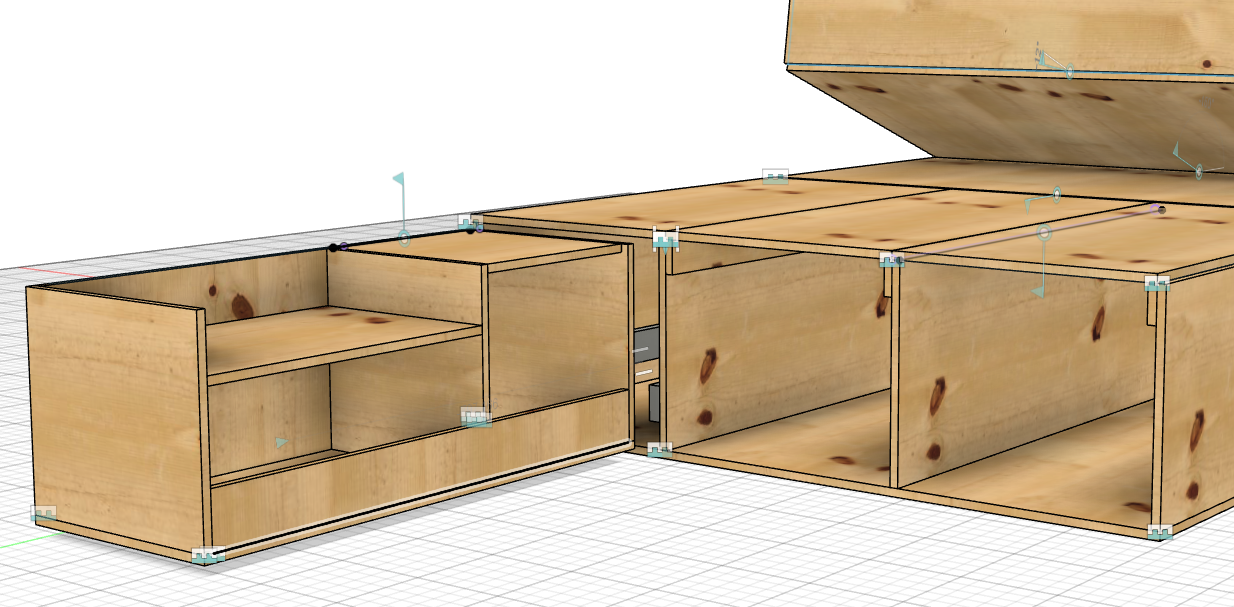
Since the measurements and the cuts needed to be very precise for a drawer, I got back onto Fusion 360 and came up with this basic design:
The main requirement for this design was that I could fit a small double stove camping burner on the main shelf, so I took a few measurements from potential candidates and made the kitchen drawer around them.
While designing the drawer, I also had to make sure that the pieces would fit together nicely with the runners, which I hadn’t quite bought yet. A quick trip to a few hardware stores revealed that runners are sold in standard lengths, and of course, my box didn’t fit any of those standards. Luckily, an online website called Furnica was selling a wider variety of runners and had one that was almost the right size for me, 750 mm vs 788 mm of my boot jump. Using these runners meant the drawer wouldn’t open for its entire length, but 4 cm less is not a big deal, so I bought them for ~£40.
With the exact dimensions of the runners in place, I could finalise all the measurements of the drawer and make another cut list to send to the woodshop. To my surprise, when I inquired about this new order (that was meant to be much smaller than the first one), they took a very long time to reply, and when they finally got back to me, they asked me a whopping £106!! Considering that the entire boot jump cost me £117 and it was twice the number of cuts and material, that took me completely out of the blue. Luckily, my local hardware store came once again to save me with a much cheaper quote of just £22, service included!
Assembly
By the time I started assembling the kitchen drawer I felt much more confident about what to do. However, I had never installed a drawer before, and I wasn’t sure how it worked. Do I put the fixed element first or the moving one? How do I make sure they’re aligned? How do I screw them in without interfering with their function?
As always, there are YouTube tutorials for everything, including how to install drawers on wooden furniture. I still had a few issues with interference between some screw heads and the runners, but after a bit of debugging, I managed to get it to work smoothly. I’m also very grateful for my past decision of not using glue to fix the entire structure together, otherwise it would have been a terrible pain to install the drawer without access from the top!
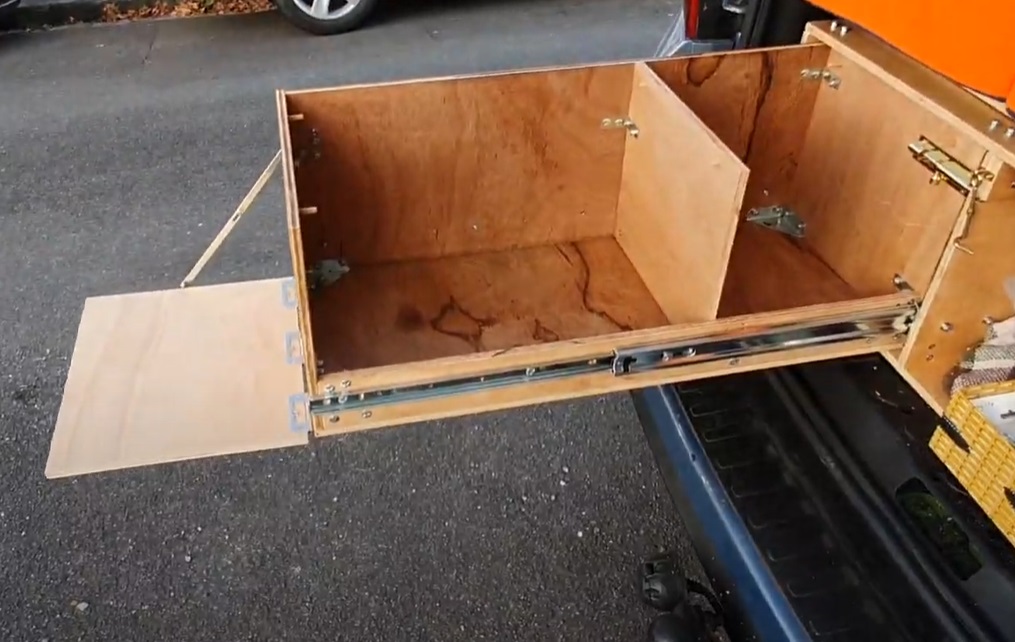
In the end, I also decided to change the layout of the shelves. Since I didn’t plan on buying a full-size burner anymore, I mounted the shelves on the top of the drawer to maximise the space inside. I also fixed them with some simple dowels, so that they would stay open for access and I could remove them completely if I need to.
Locking mechanism
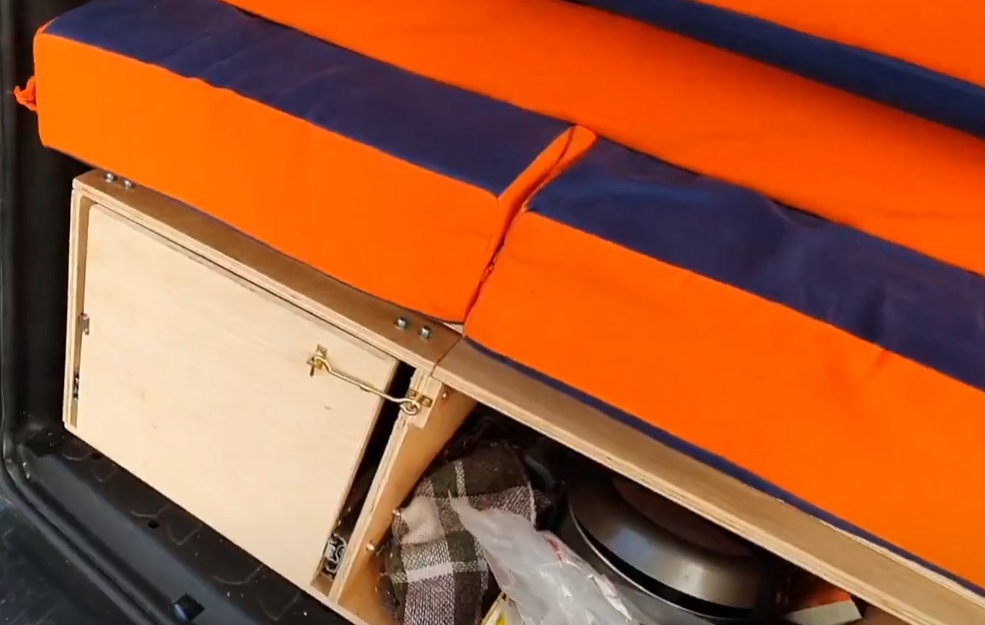
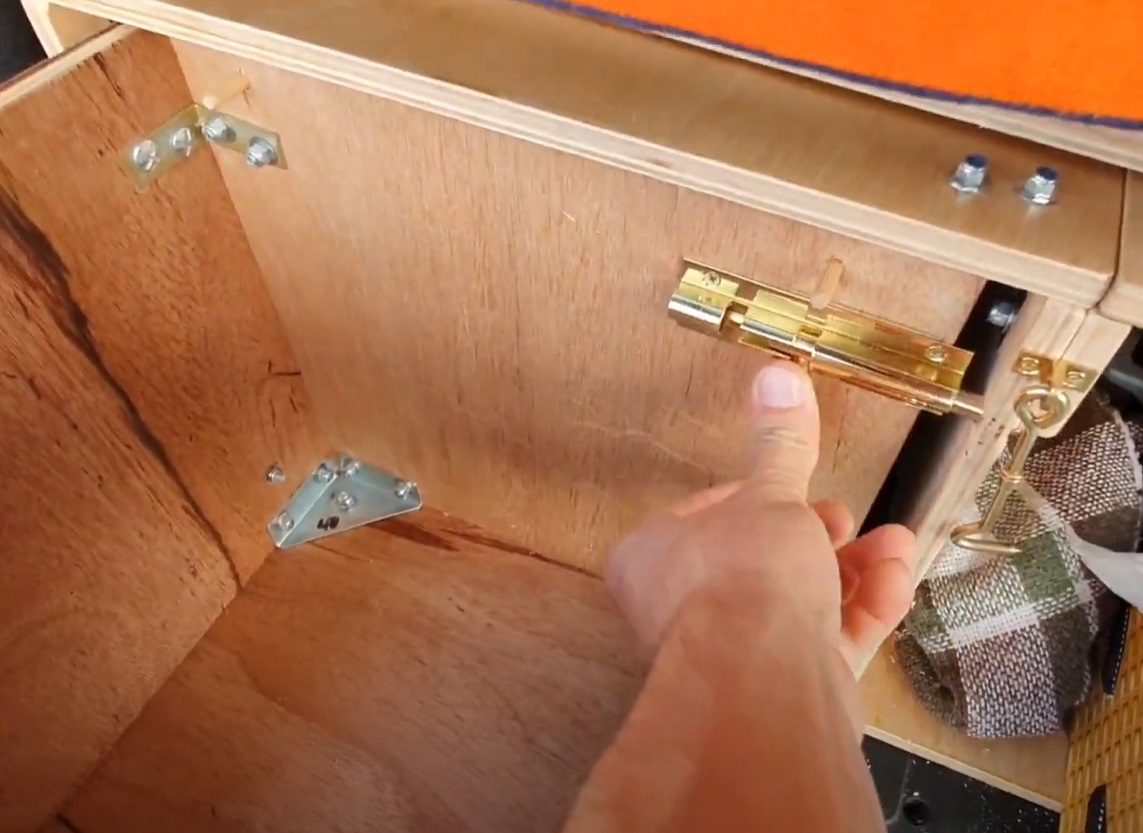
One problem that I had to fix at this point was how to keep the drawer open or shut when I’m driving or parked on a hill. I wanted to find a smart and elegant solution that would work in both cases, keeping it open when it’s open, and shut when it’s shut, but after my usual trip to the local hardware store, I couldn’t find anything inspiring that worked for both. The easiest (and cheapest) solution that I found was to use two different door latches – a simple hook and eye latch to keep it shut on the outside and a sliding latch on the inside to keep it open.
Extremely simple, yet extremely effective.
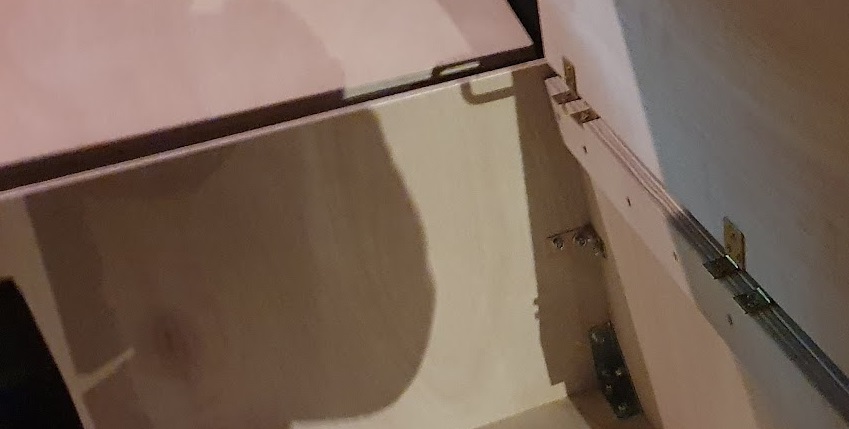
As a final touch, I also installed an additional shelf on the front door of the drawer, to have some extra space when cooking. The shelf is attached to the bottom drawer using flush hinges and it stays in place thanks to a drop-down flap stay hinge installed on the side. An additional toggle latch on the side of the drawer keeps the shelf in place when closed.
Now the van is really ready for the next adventures!
Conclusions
Final bill
Here’s a summary of what I spent for the entire conversion. I don’t have the individual prices for each item but I added a description for what a bought on each trip to the shop.
Description
Where
Cost
Bosch power drill
B&Q
£55
Electric Jigsaw
ASDA
£10
Wood + cutting service for main box (bed and table)
More screws, more hinges, varnish, brushes, wood glue
Bishopston Hardware
£58
Foam for mattress
eFoam
£134
More L-shapes, toggle latches and bolts
Bishopston Hardware
£18
Fabric for upholstery
Lush Fabric
£67
Drill bit and more screws
Bishopston Hardware
£7
Island table leg and supports
eBay
£30
Insulation sheet for blinds
B&Q
£5
Drawer runners
Furnica
£41
Wood + cut kitchen drawer
Bishopston Hardware
£22
Flap hinge stay, latches, drawer handle
Bishopston Hardware
£24
Total
£621
While I was being cautious with my spendings when building this conversion, I didn’t always choose the cheapest solution. I spent a total of around £600 for the conversion, but you can spend much less if you’re happy to compromise. If you already have access to power tools, you’re happy to sleep on an inflatable mattress and don’t mind having a simple shelf as a kitchen, you can probably cut down the costs to £200-£300 and still have a fully working boot jump.
Shop local
One of the things that I learnt during this build is that local hardware stores are fantastic. After doing a comparison with larger stores like B&Q, I quickly realised that they are not only cheaper and very well stocked with any sort of bits and pieces you might need, but people working there are also much more knowledgeable about what they’re selling. They will often have the time and patience to hear your problems and help you to solve them, contrarily to larger chains where employees are constantly running around and don’t really seem to have time for customers (in my personal experience). Another big advantage of local hardware stores is that they often sell things by unit. Do you need just 2 slightly larger bolts? You can go and buy them for a few pennies, no need to buy a whole 200x box!
What I’d do differently
They often say that you build your first van for your enemy, your second one for your friend and the third one for yourself. Honestly, after spending so much time doing research and planning in advance, I feel like this doesn’t really apply to my van and I’m very happy with what I built. If I could start all over again, I would surely be quicker, more precise in the assembly and save myself a few extra holes that I ended up drilling, but there wouldn’t really be any major flaw I’d redesign.
One potential problem I could have that I have yet to experience is dealing with rainy days. While I can comfortably spend the day indoors, accessing the kitchen drawer for food and cutlery requires me to get out of the car and open the boot, which might not be ideal. I could easily replace the L-brackets of the bench with hinges and latches, but I’m afraid the whole structure would lose rigidity. On the other hand, since the boot door opens up vertically, it works perfectly as a roof in case of bad weather, allowing me to potentially cook and eat outside even when it rains. Amdro sells an entire tent that attaches to the boot door and gives you even more space, but it costs £430 just for the tent and it’s not very stealthy. If I really feel the need, for the future, I could always buy a plastic sheet, cut it to shape, attach it with magnets/clips to the boot door and get myself a gazebo.
Cooking indoors is also a possibility, especially using the simple camping stove kit that I’ve got. I’ve done that once by simply putting the table between the two benches, so that It’s not too high and close to the roof, although I still opened the boot being scared of potential CO/CO2 build-up.
Storage
Storage in the van is a bit of an issue. I have travelled with the van for a whole week with climbing gear and I definitely felt the lack of extra space. While all the food and water can stay under the table and bench, all the clothes, shoes and climbing gear were constantly moved around from the front seat, while sleeping, to the bottom of the rear seat, while driving. The original design of the boot jump from Amdro improves the storage problem by removing the entire rear bench of the car and adding an additional flap on the bed to keep it in place. While this surely frees up a lot of space, it requires you to unbolt the entire bench, which can be time consuming and potentially unsafe if you don’t know what you’re doing.
My solution for the future is probably going to be a roof box. It can be as big as you need and adds an enormous quantity of space without modifying the car at all. It also works as a good replacement for the boot space that you lose by keeping the boot jump in the car all the time. The only problem is that they’re expensive. Like £300-600 expensive.
Tips for a good night sleep
On my first night out I didn’t sleep really well as I was constantly worried that “something” might happen. If you don’t feel confident wild-vanning, stopping at a campsite can buy you some peace of mind, but I always found that parking in the most remote locations is much more pleasant and rewarding, especially when you get used to it. To find an ideal spot where to sleep I often start with park4night, which has a handy Android app with offline maps. The app shows you a variety of possible locations where to spend the night, with pictures, description of facilities and even reviews. However, I often found myself finding my own spots in the middle of nowhere. I usually drive towards the countryside, maybe on a nice hill with a view and then get through the most isolated B-roads to find a large enough layby area where to spend the night.
One essential requirement to have a good night sleep is to park as level as you possibly can. On my first night, I parked on a slope thinking that it was flat enough. Well, it wasn’t, and I spent the entire night crawling back up the bed. Now I got a better idea of what “flat” should look like but a car inclinometer, usually found in off-road vehicles, can be a cheap investment for finding the best angle for the perfect night sleep.
Sleeping bags are also very handy for sleeping in the van, since they pack up very small. However, having a full-size duvet taken from the bed at home, with real pillows, will provide you with the best night sleep you can dream of!
Outro
And this is it. I hope you found some parts of this article interesting and maybe convinced you to buy a van as well. The freedom of being able to sleep wherever you want, whenever you want, is one of the best feelings you can experience.
Here are some pictures of the final conversion and the steps to set it up. It took me exactly 3 minutes and 20 seconds to go from zero to sofa mode with the table open (probably just 2 minutes for bed mode).
Following are a few more pictures of some picturesque places where I spent the night: